Svaroots
Svaroots
One sneaker, swappable patches, one person running it. And three numbers no dashboard reports.
Brand Packaging featured on


Role
Role
Product / UI Designer
Individual Project
Individual Project
Discipline
Discipline
Visual Interface Design
& Design Management
& Design Management
Tools
Tools
Figma, Figma Make
Figma, Figma Make
GitHub, Vercel
GitHub, Vercel
THE SHORT VERSION
THE SHORT VERSION
Three numbers this brand runs on. None of them exist in a standard dashboard.
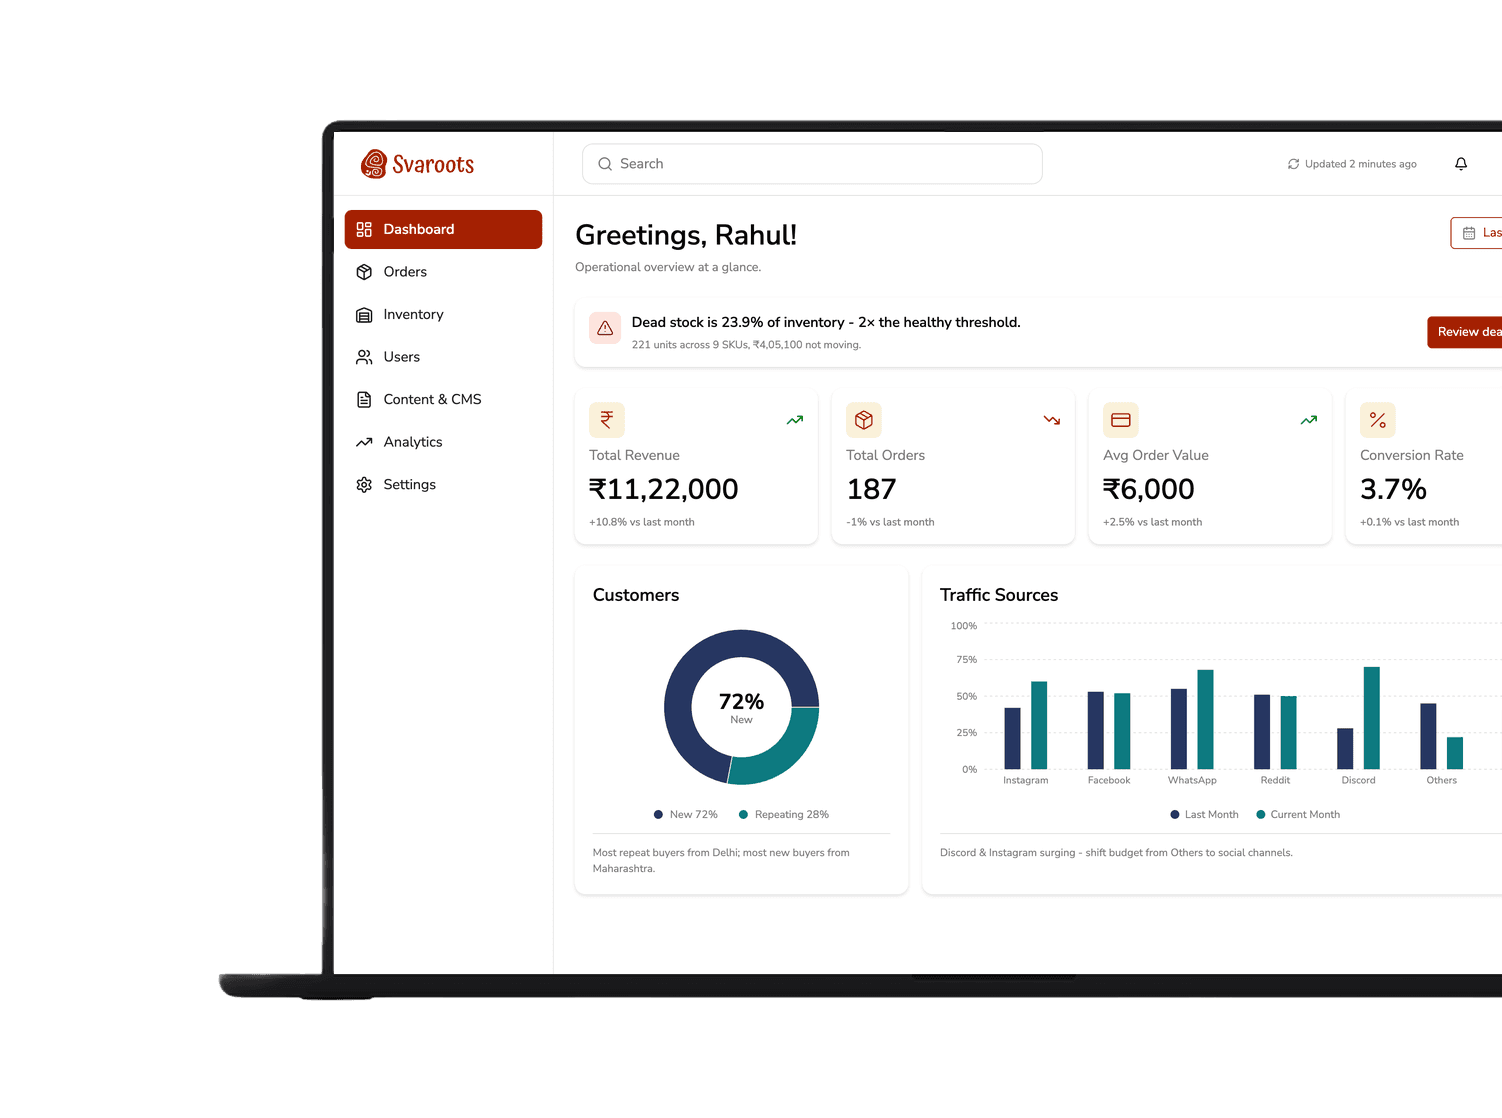
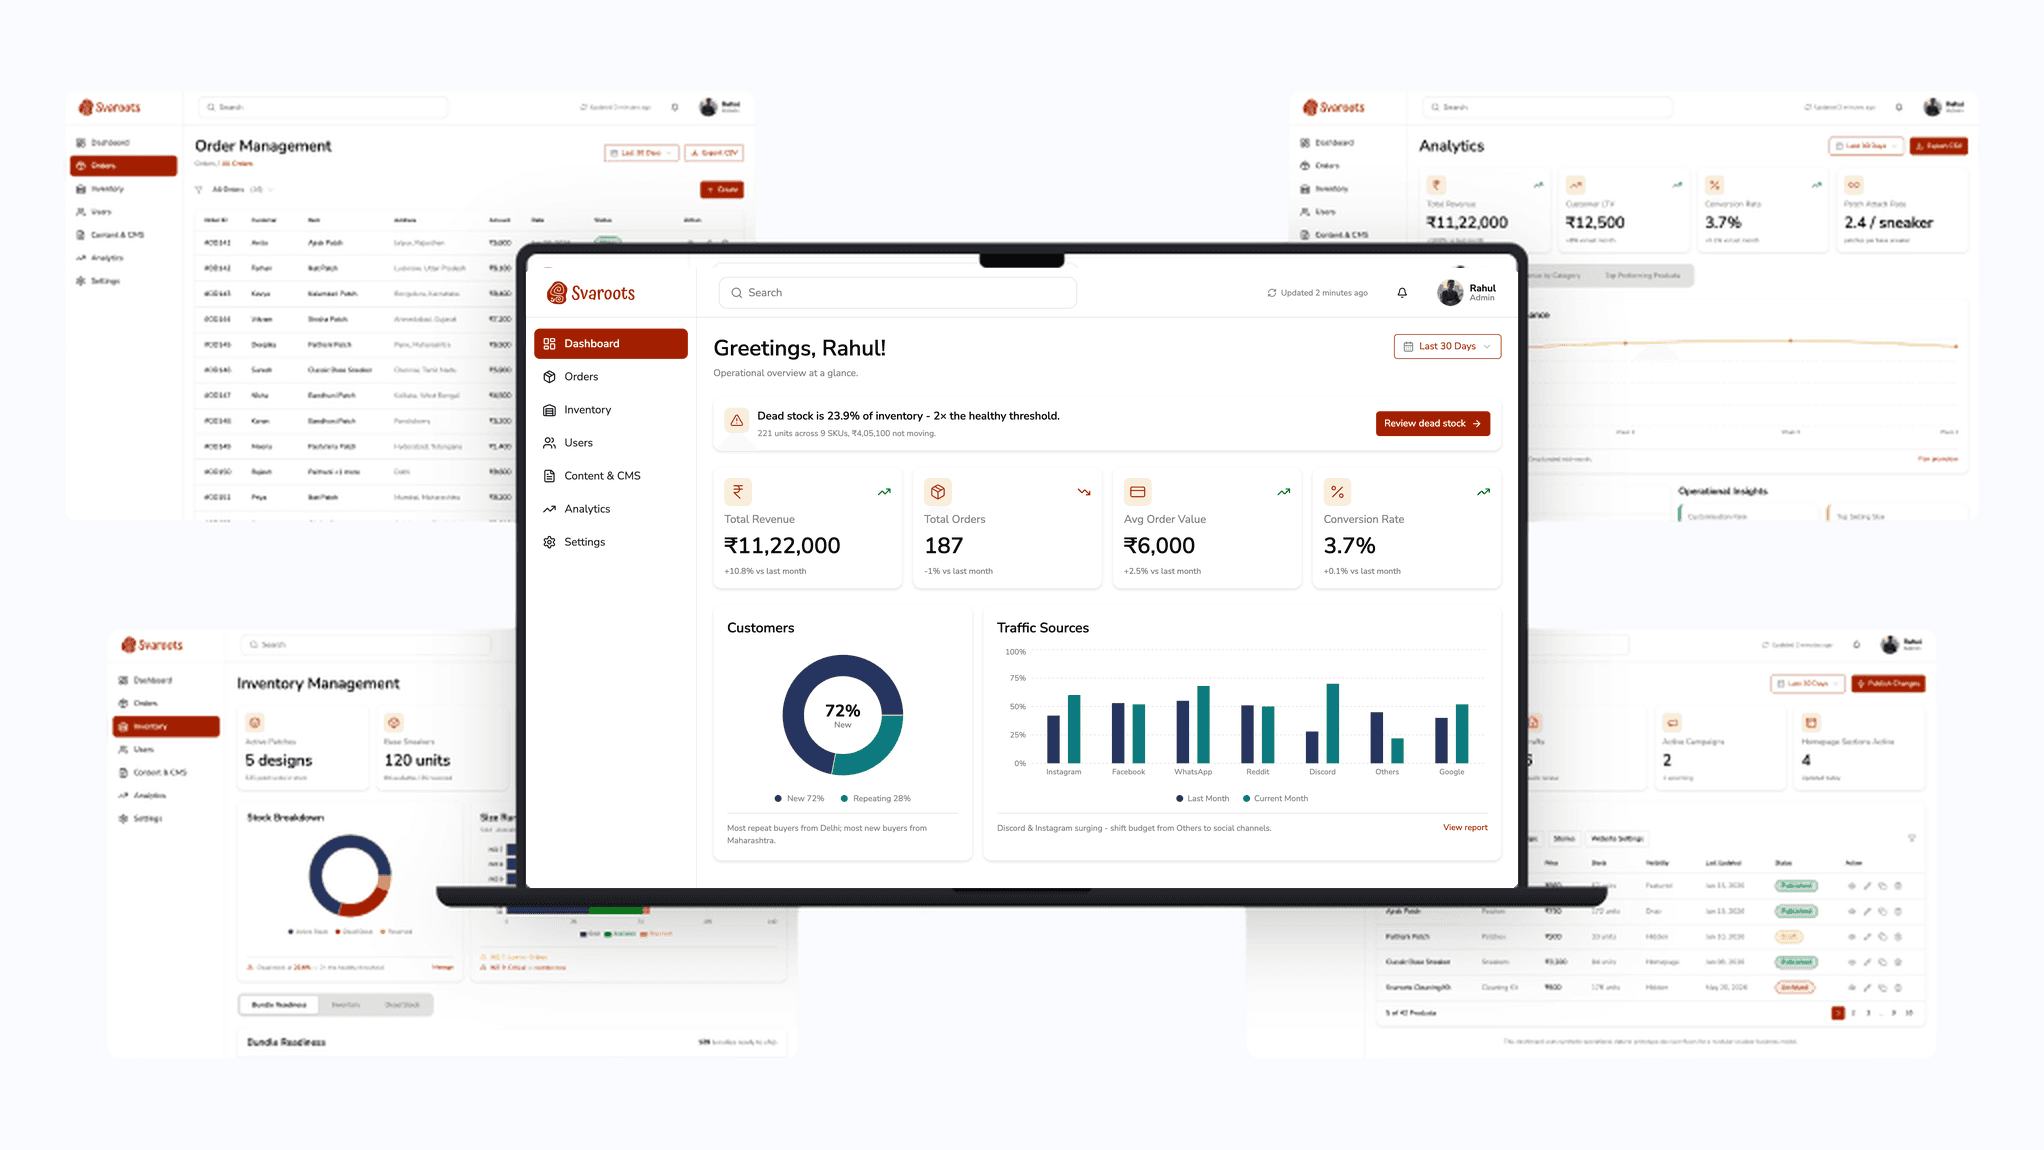
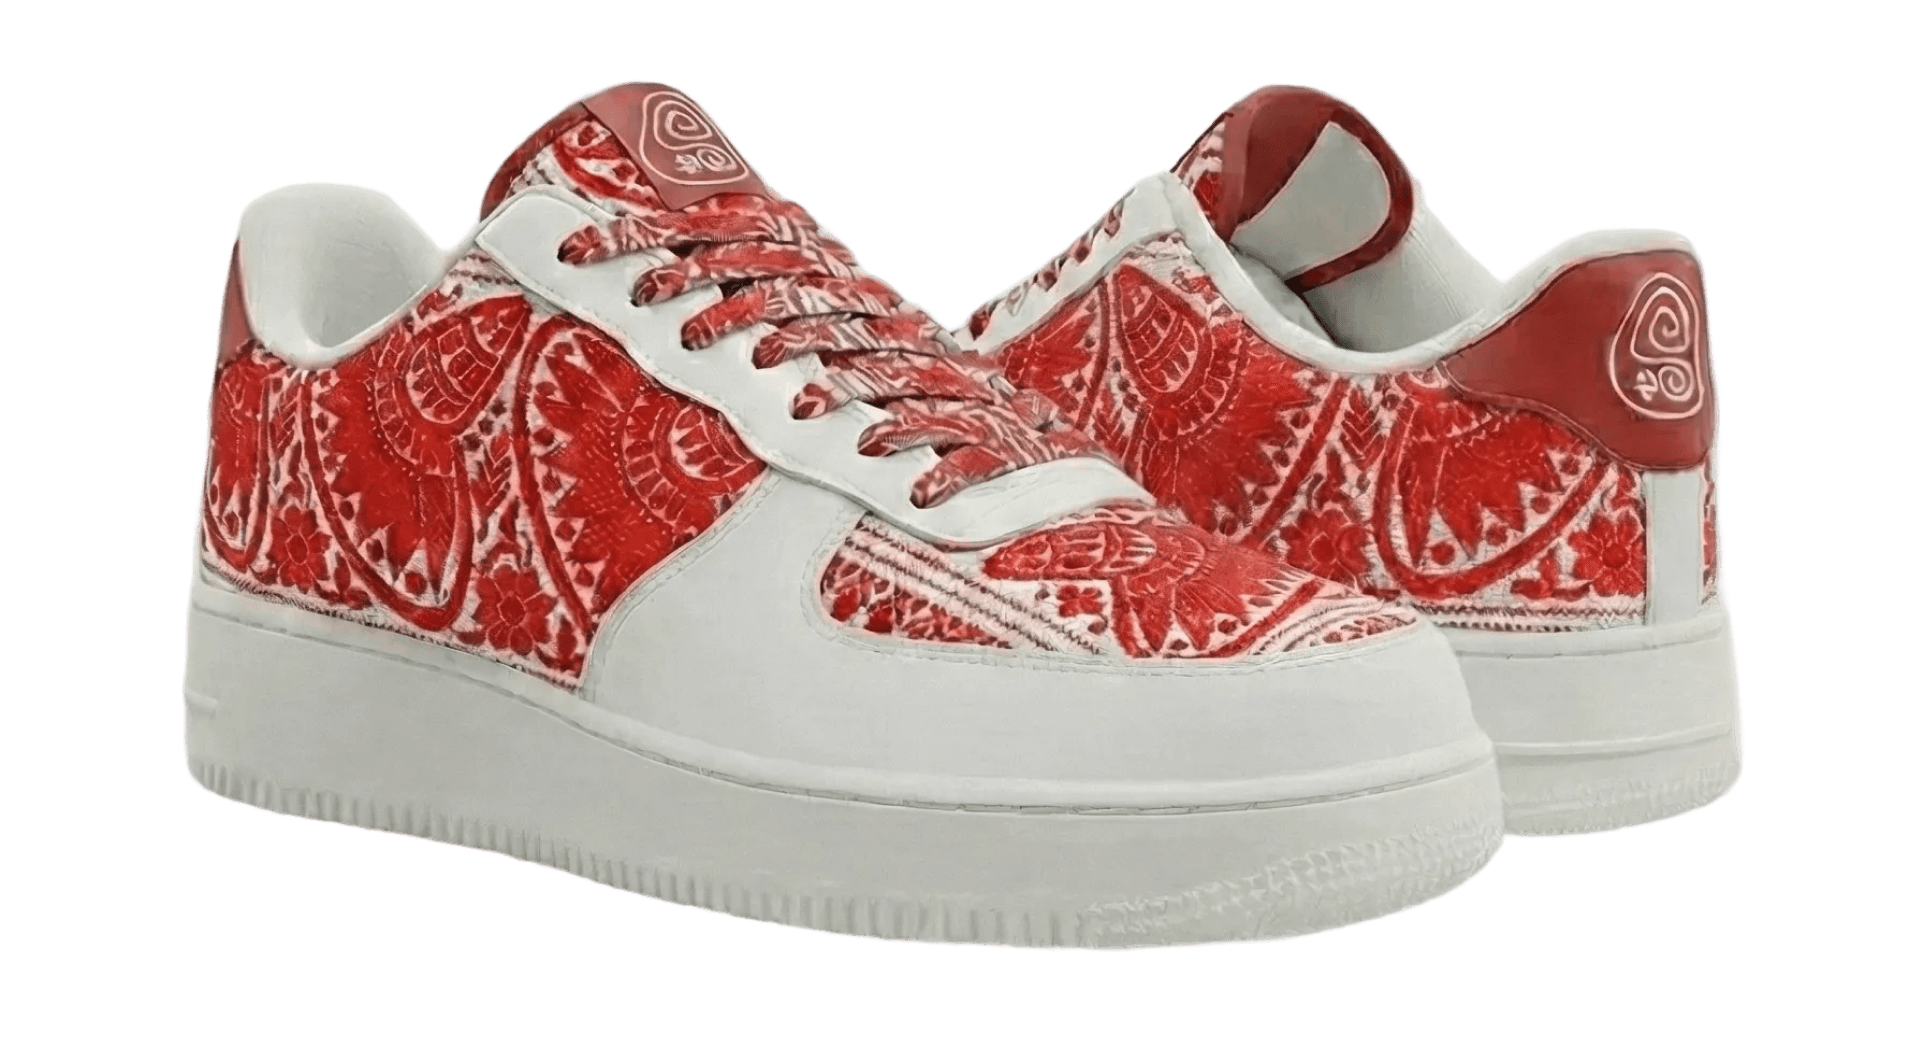
Svaroots is a modular sneaker brand: one base shoe, swappable textile patches. Rahul runs the whole thing alone. I designed the operations dashboard, then built and shipped it.

SEE IT BEFORE YOU READ IT
It shipped. Try the dashboard.
Designed in Figma, built with Figma Make, pushed to GitHub and deployed on Vercel.
WHAT THIS CASE STUDY COVERS
Competitive audit
Competitive audit
Metric design
Metric design
Information architecture
Data visualisation
Data visualisation
Design → shipped code
A modular brand breaks the metrics every commerce dashboard assumes. I designed the three that were missing, proved the gap in a live Shopify store, and shipped it.
01
01
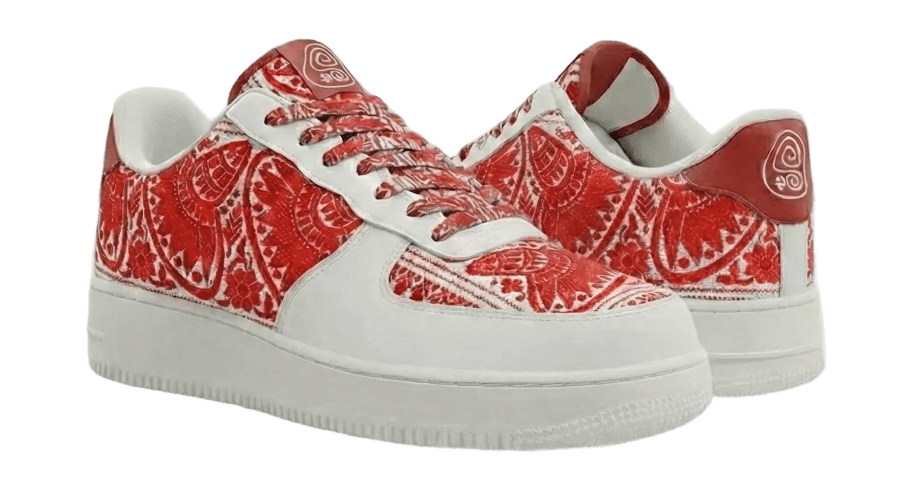
One sneaker, many identities
A conceptual brand built on Indian textile traditions. The team built the brand. I built the dashboard.


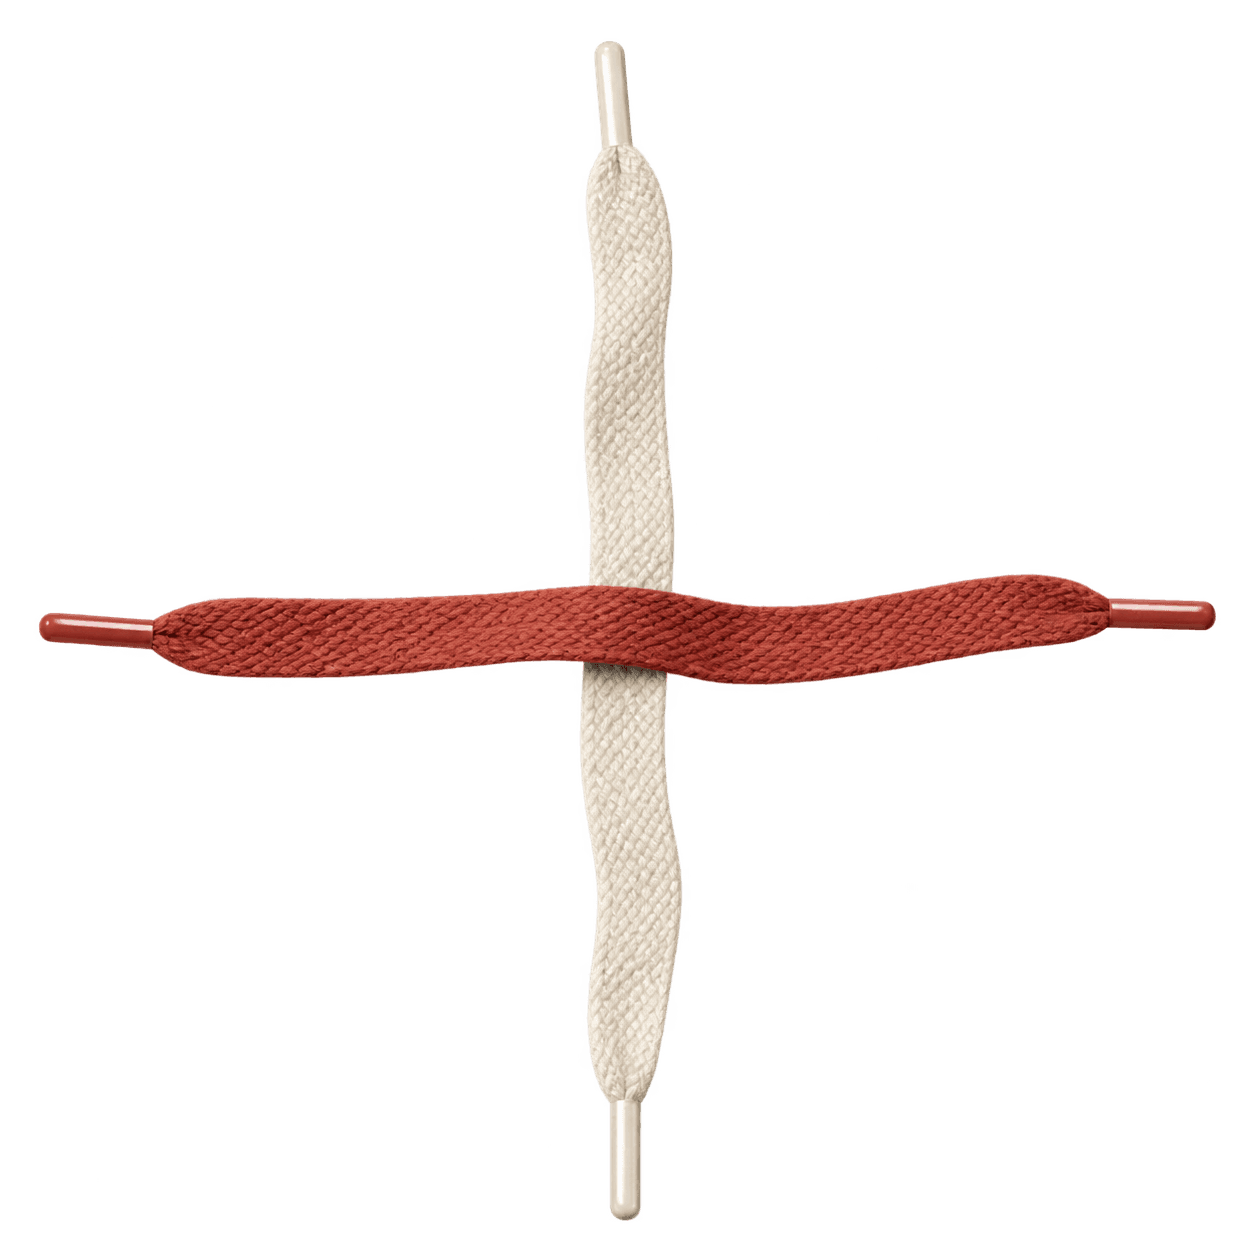
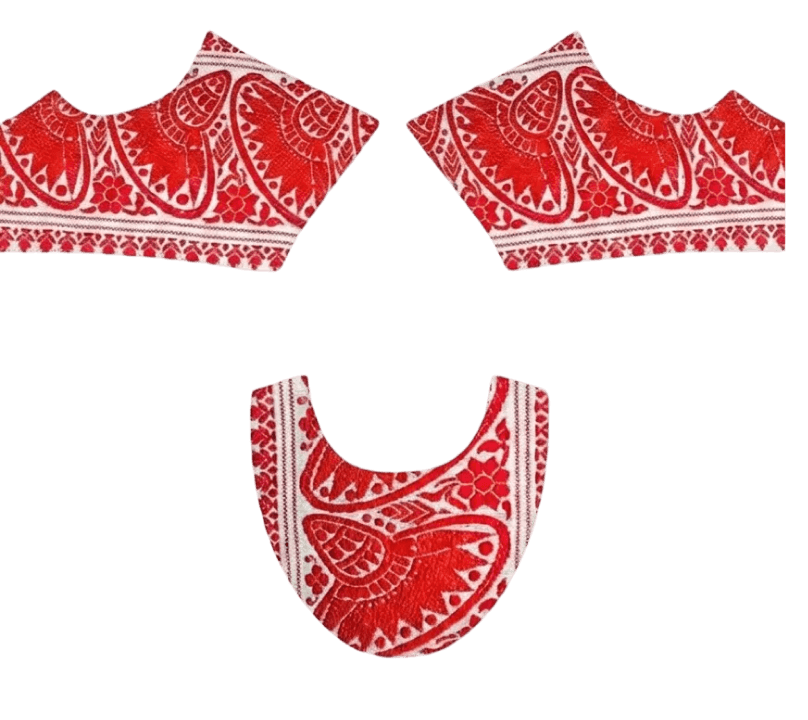
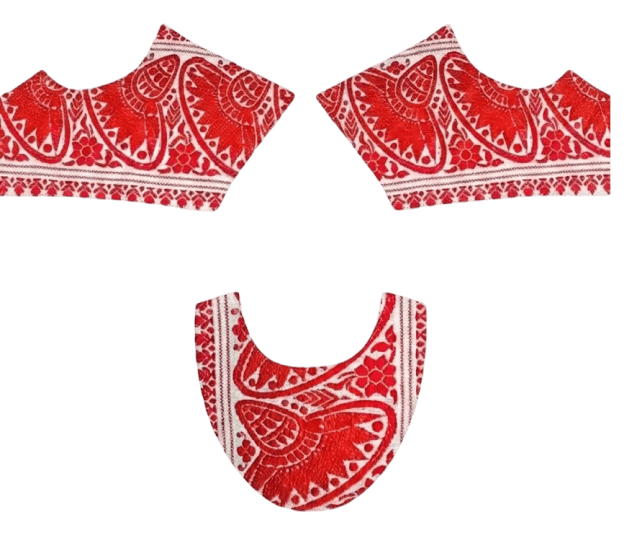
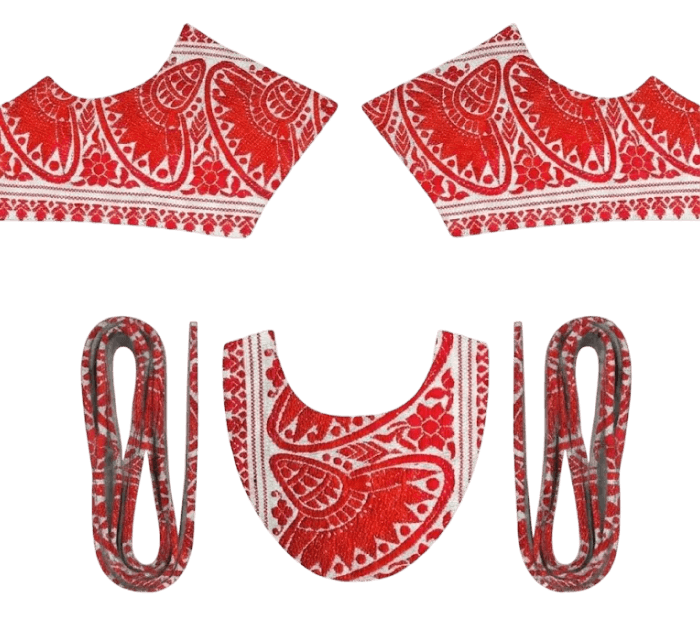
Left Quarter Panel
Left Quarter Panel
Right Quarter Panel
Right Quarter Panel
Vamp/ Toe Overlay
Vamp/ Toe Overlay


Base Sneaker
Base Sneaker
Gamusa Patch
Gamusa Patch
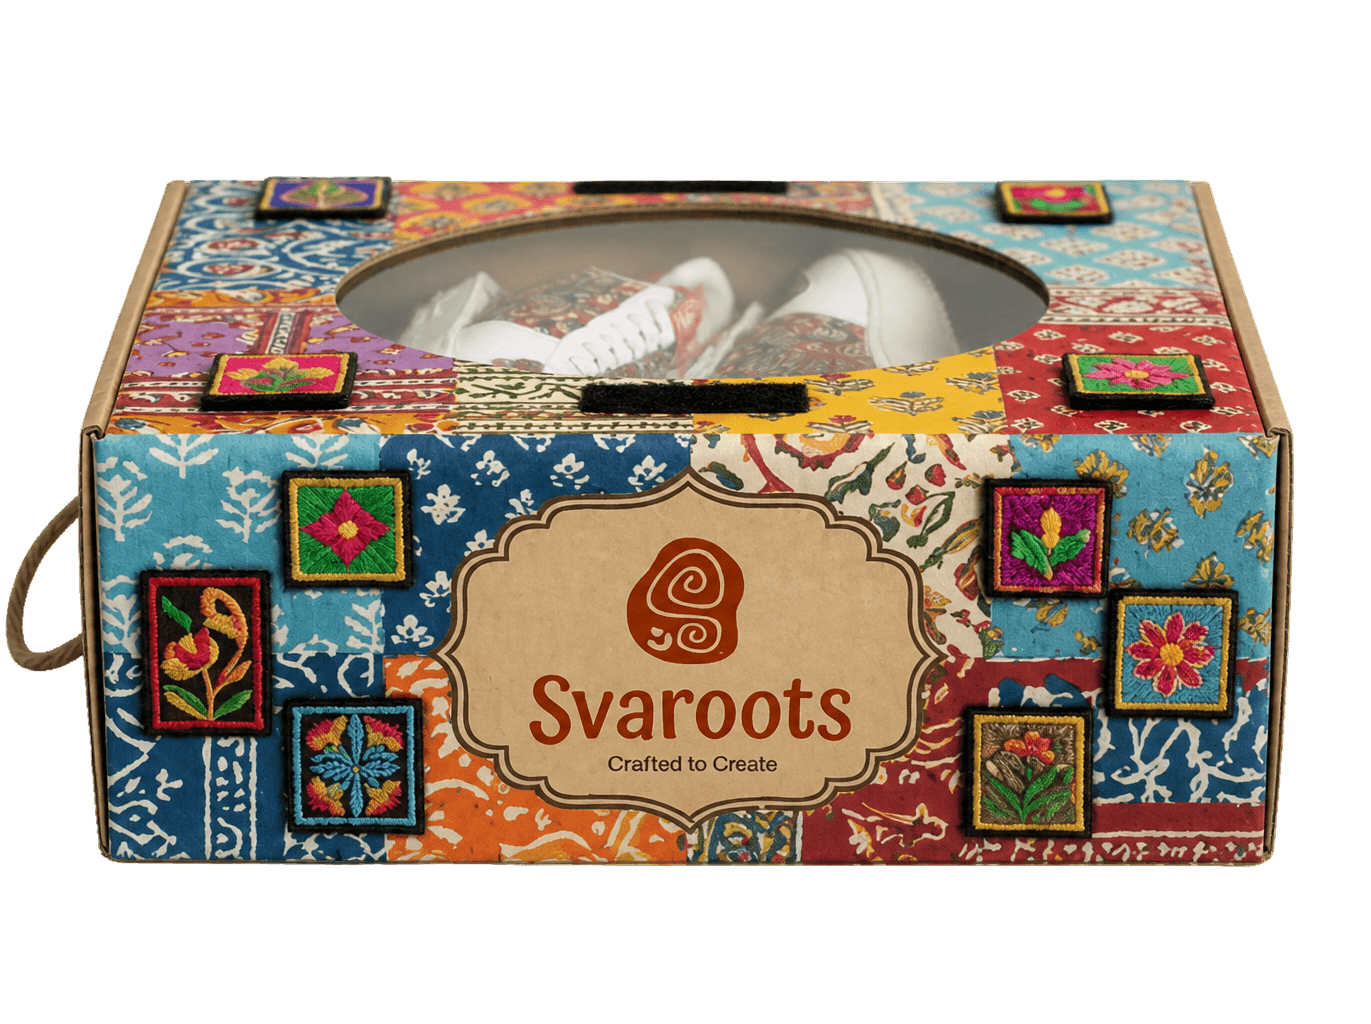
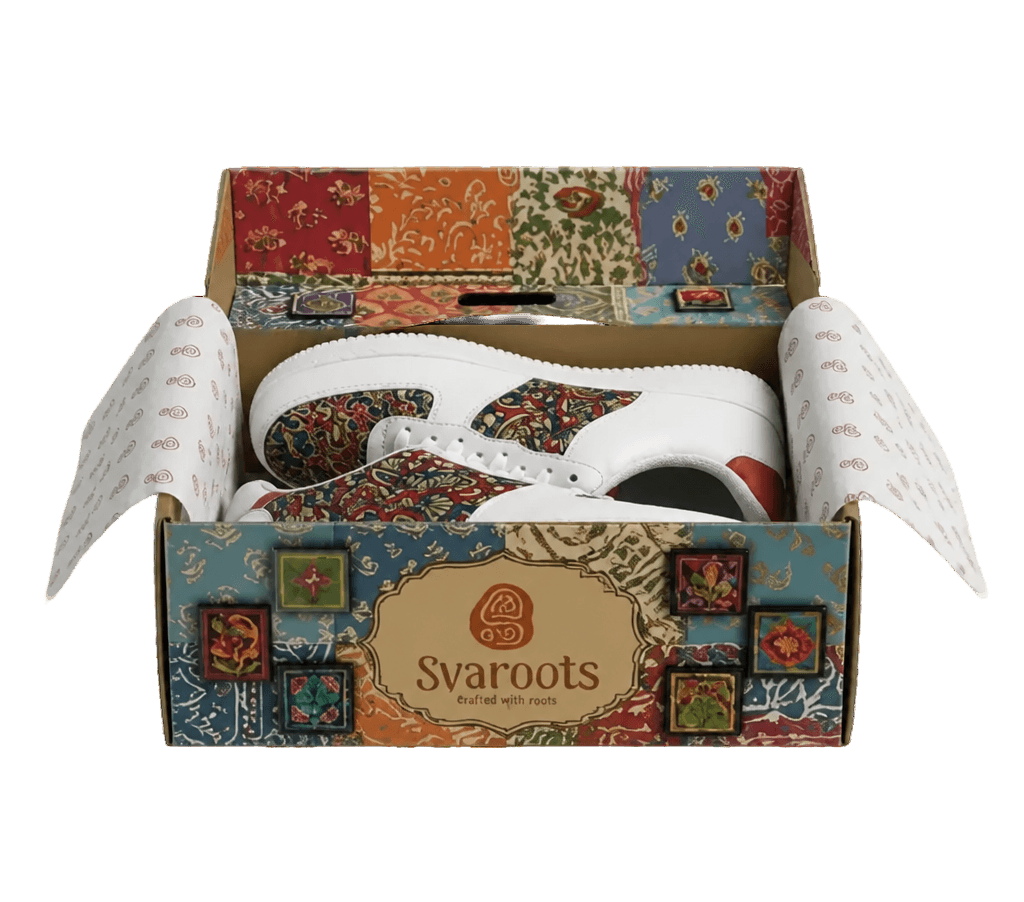
The brand around it
The brand around it
Brand identity, storefront, packaging and visual language were developed collaboratively.


THE ASSUMED SETUP
THE ASSUMED SETUP
One online store
One online store
No physical retail
No physical retail
One warehouse
One warehouse
Everything ships from here
Small team
Small team
No analyst, no ops team
One operator
One operator
Runs the whole system alone
Everything below follows from the fourth card. One person, no analyst. So the dashboard had to answer, not just report.
02
02
One person runs everything
No ops team. No analyst. One person keeps orders moving and stock honest.


Rahul
Rahul
E-commerce Operations Manager
ROLE
ROLE
E-commerce operations manager. One online store, one warehouse, a small team.
GOAL
GOAL
Keep the online business running smoothly, and act quickly on anything that needs attention.
PAIN POINT
PAIN POINT
Information is spread across different operational areas, making it difficult to know what needs attention first.
WORKS ACROSS
WORKS ACROSS
Orders
Inventory
Customers
Performance
Orders
Inventory
Customers
Performance
THEIR DAILY LOOP
THEIR DAILY LOOP
01
01
Check the business
Check the business
→
→
02
02
Spot an issue
Spot an issue
→
→
03
03
Understand why
Understand why
→
→
04
04
Take action
Take action
The dashboard had to fit inside this loop.
03
03
A patch is a product and a part
A patch sells on its own and works as half of a bundle. A normal dashboard counts each sale, but cannot tell you whether the modular idea is working.
WHAT SVAROOTS ACTUALLY SOLD

Base sneaker
Base sneaker
Sold on its own
Sold on its own

Textile patch
Textile patch
Sold on its own
Sold on its own


Bundle
Bundle
Sneaker + patch, sold together
The same patch sits in card two and card three. Sell one on its own, and a bundle quietly disappears.
QUESTIONS THIS CREATED
01
01
Are customers actually using the customization system?
Answered by Customization Rate.
02
02
How many patches are being sold per sneaker?
Answered by Patch-to-Sneaker Ratio.
03
03
How many complete bundles can we fulfil?
Answered by Bundle Readiness.
04
04
Which inventory is becoming dead stock?
Answered by standard reports.
THE DESIGN CHALLENGE
How might I design an operations dashboard around the decisions created by Svaroots’ modular business model?
04
04
I stopped assuming and opened Shopify
I had assumed a generic dashboard could not run this. Rather than keep asserting it, I set up a Shopify store and checked.
COMPETITIVE AUDIT · RUN INSIDE A LIVE SHOPIFY STORE
Shopify runs the bundle calculation. It never reports it.
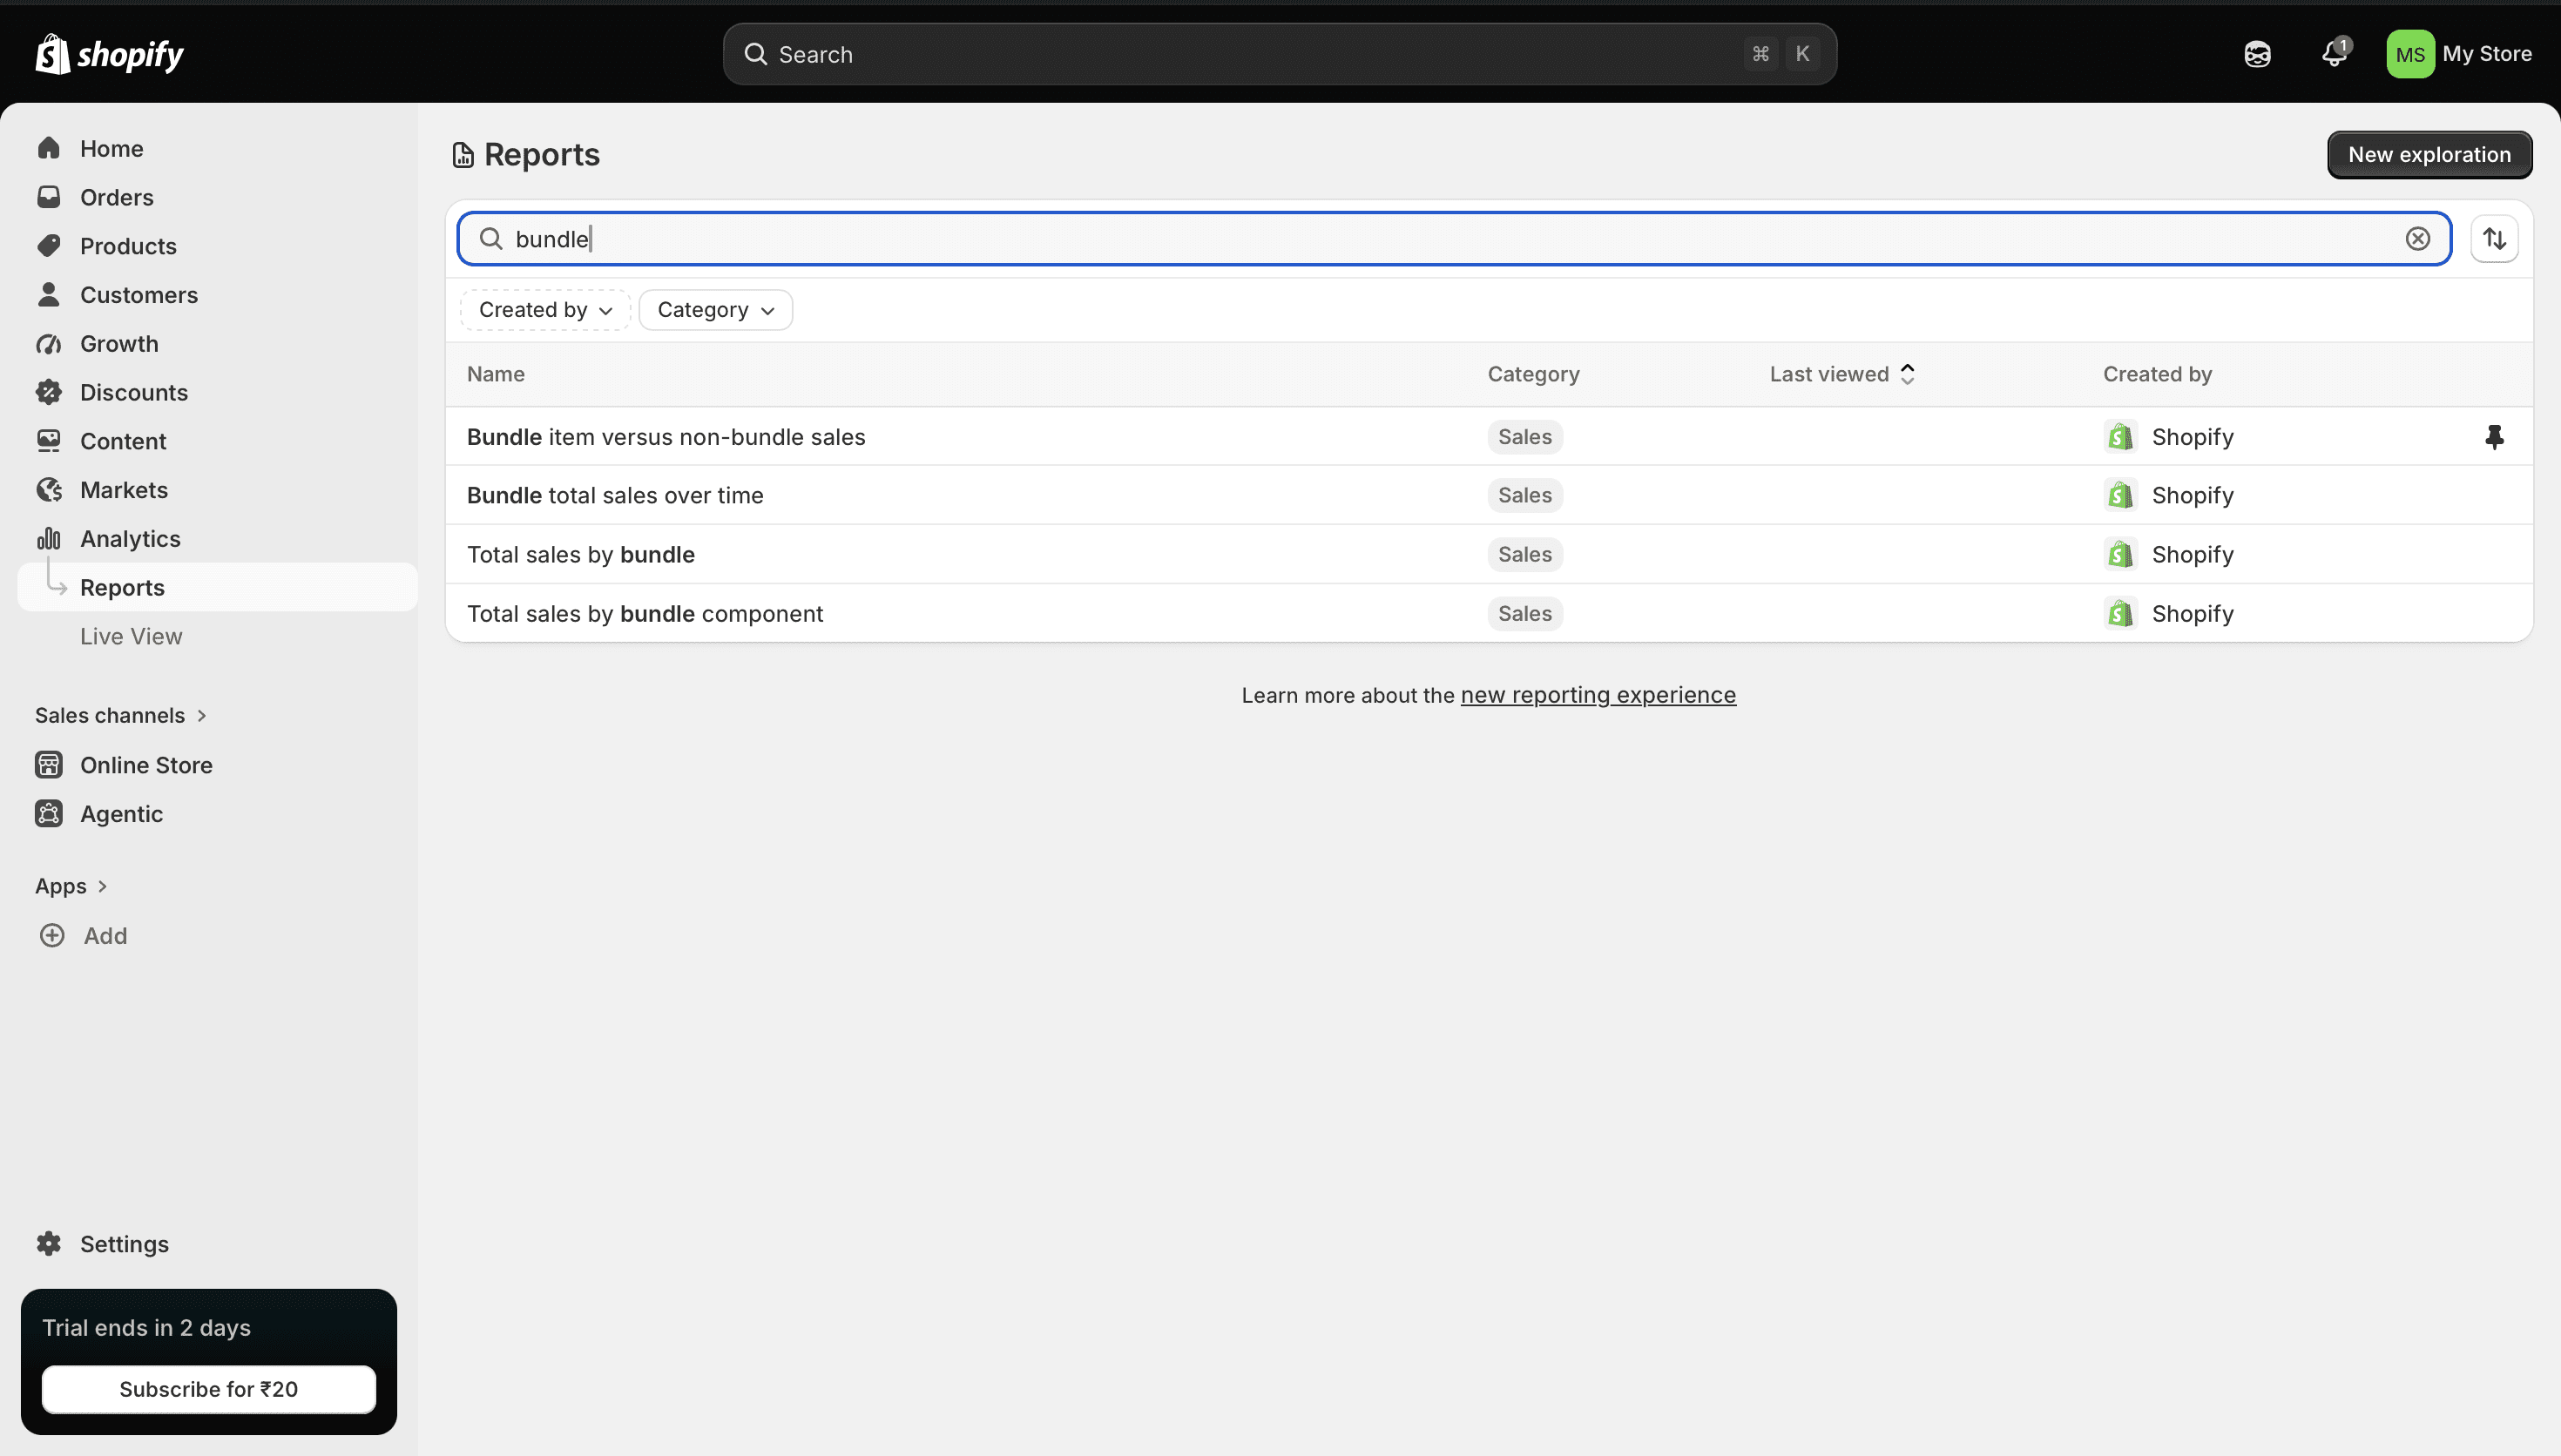
Searching the report library for “bundle” returns four reports. All four are Sales. None is Inventory.
WHERE SHOPIFY STOPS
WHERE SHOPIFY STOPS
Shopify Bundles
Shopify Bundles
WHAT THE CUSTOMER SEES
Ajrakh bundle · 9
Ajrakh bundle · 9
Sold out
Sold out
WHAT RAHUL SEES
WHAT RAHUL SEES
?
?
which half ran out? which size?
It knows a shoe is a sneaker plus a patch. If either half runs out, it stops selling the pair.
But it only talks to the customer, and all it says is sold out. It never tells Rahul which half ran out, or in which size.
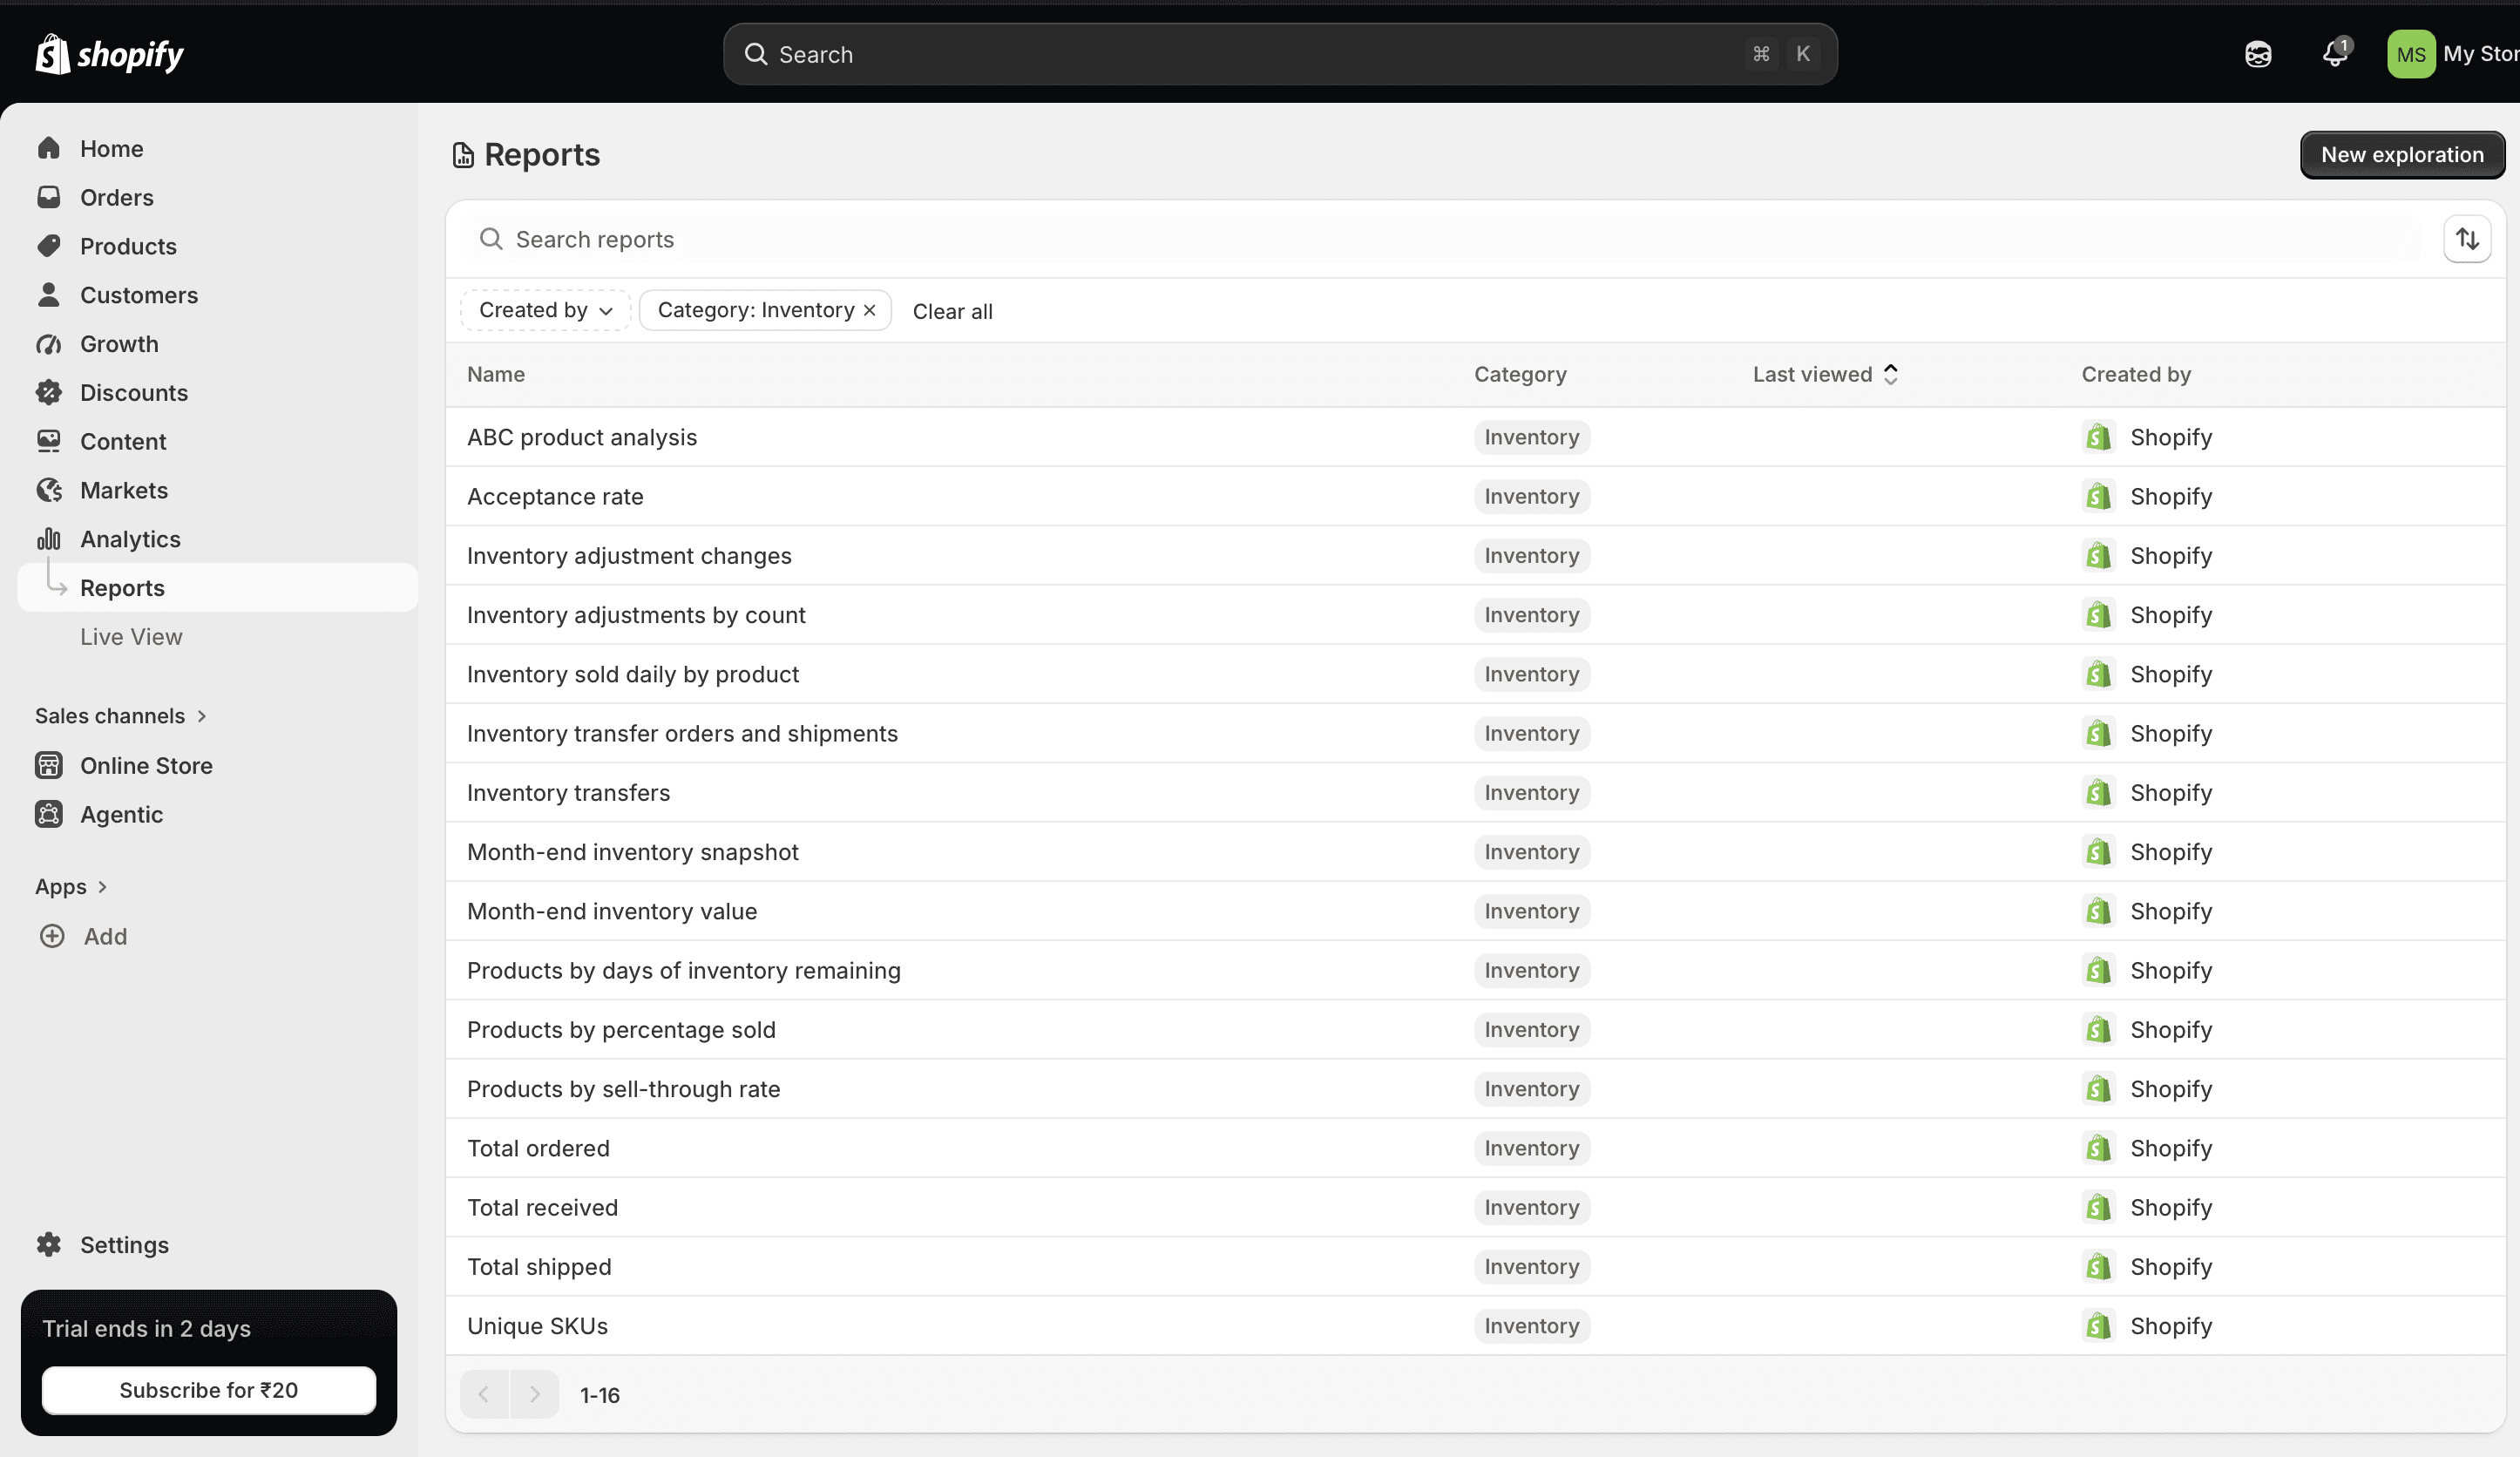
THE EVIDENCE · SHOPIFY’S OWN REPORT LIBRARY

1
1
1
1
Sixteen inventory reports, every one tagged Inventory. Read the names. Not one is about bundles.

2
2
2
2
Search “bundle”: all four results are tagged Sales. None is Inventory.

3
3
3
3
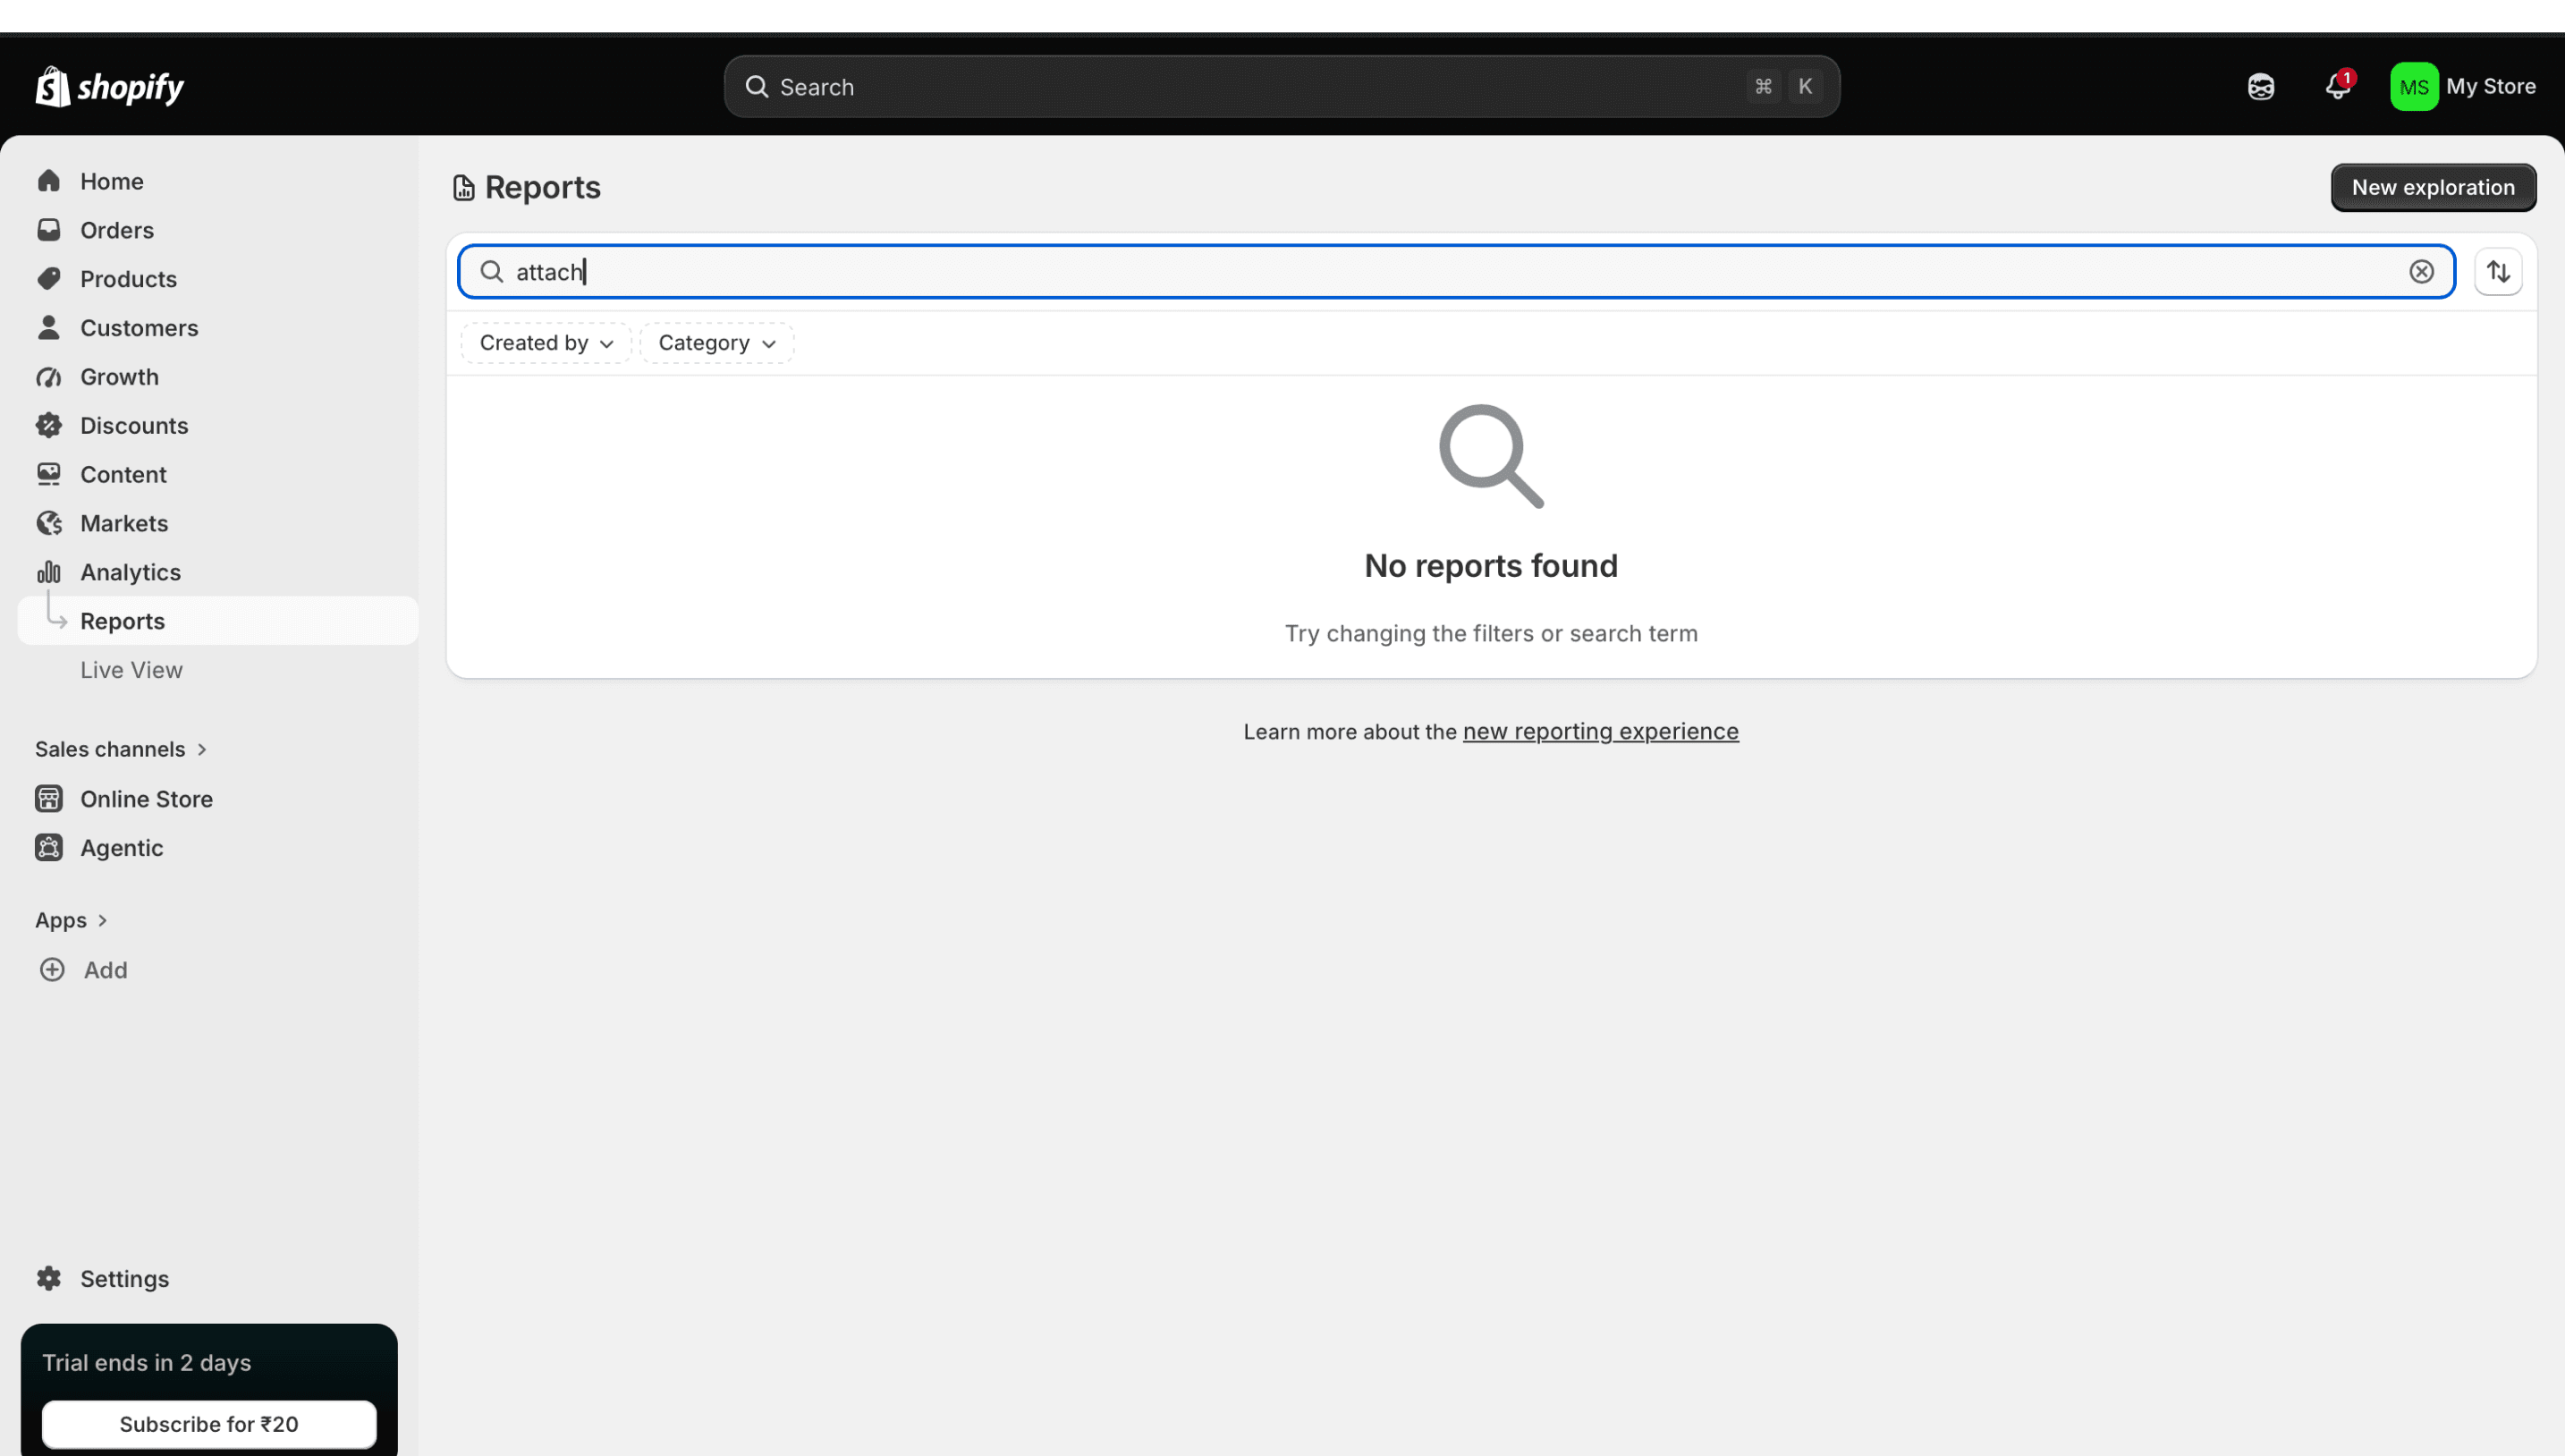
Search “attach”: no reports found at all.
WHAT THE AUDIT RETURNED, METRIC BY METRIC
Patch-to-sneaker ratio
NOT REPORTED
NOT REPORTED
No default report expresses a ratio between two product categories.
Customisation rate
Customisation rate
NOT REPORTED
NOT REPORTED
No default report on attach rate. Custom exploration only.
Bundle readiness
Bundle readiness
CALCULATED, NEVER SHOWN
Shopify computes it to gate the storefront. No inventory report shows it.
Dead stock
Dead stock
MEASURED, NOT MANAGED
Shopify reports slow stock well. It has no reason, no status and no threshold alert.
Verified 5 Sept 2026 in a live Shopify store. I had expected to build the dead-stock measurement myself. I did not need to. I did not test Zoho, Katana or third-party bundle apps, so I make no claim about them.
05
05
Three numbers I had to add
Standard metrics covered most of this business, including how to spot slow stock. The modular half needed three that no report provides.
CONCEPTS I HAD TO LEARN
Customer Lifetime Value
VIP & Dormant Customers
Inventory Runway
Inventory Runway
Return Rate
Return Rate
Revenue
Revenue
Product Performance
Product Performance
METRICS SPECIFIC TO SVAROOTS
2.4
2.4
Patch-to-Sneaker Ratio
Patches sold per sneaker.
68%
68%
Customization Rate
Customization Rate
How actively customers use the modular option.
195
195
Bundle Readiness
Bundle Readiness
How many complete pairs can actually ship.
That moved the dashboard from reporting sales to showing whether the business model was actually working.
PATCH-TO-SNEAKER RATIO · ANALYTICS

1

1
It sits beside revenue, LTV and conversion, so the modular signal is read with the standard ones.
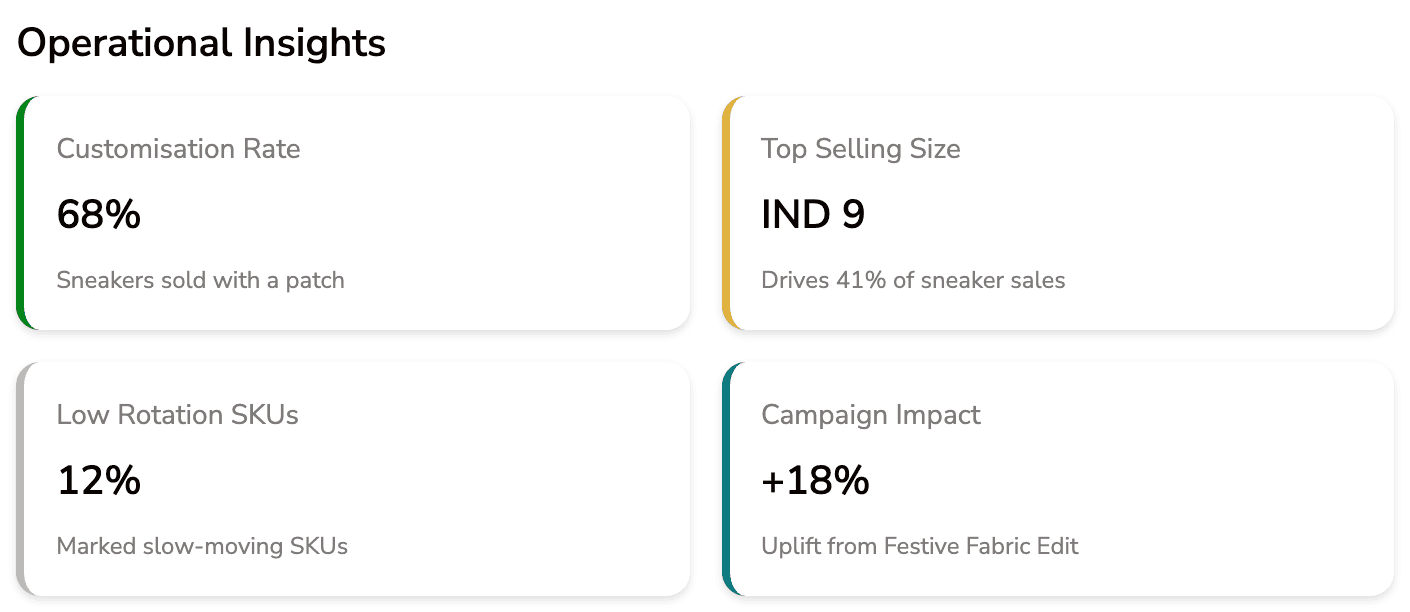
CUSTOMIZATION RATE · OPERATIONAL INSIGHTS

1
1
How many sneakers leave wearing a patch at all, currently 68%.
06
06
Stock you own is not stock you can sell
Sneakers, patches and bundles all sell separately. So every patch sold on its own quietly reduces how many bundles are left to ship.
WHAT A BUNDLE ACTUALLY NEEDS
1 sneaker
1 sneaker
+
+
1 patch
1 patch
=
=
1 bundle
1 bundle
IN THE WAREHOUSE
IN THE WAREHOUSE
1 sneaker
1 sneaker
+
+
3 patches
3 patches
IN STOCK
IN STOCK
4
4
individual items
individual items
→
→
CAN SHIP
CAN SHIP
1
1
complete bundle
complete bundle
Four items in stock. One bundle can ship.
And the other patches keep selling on their own, so this number moves without anyone touching a bundle. That is why the operator needs it as a live view, not a checkout rule.
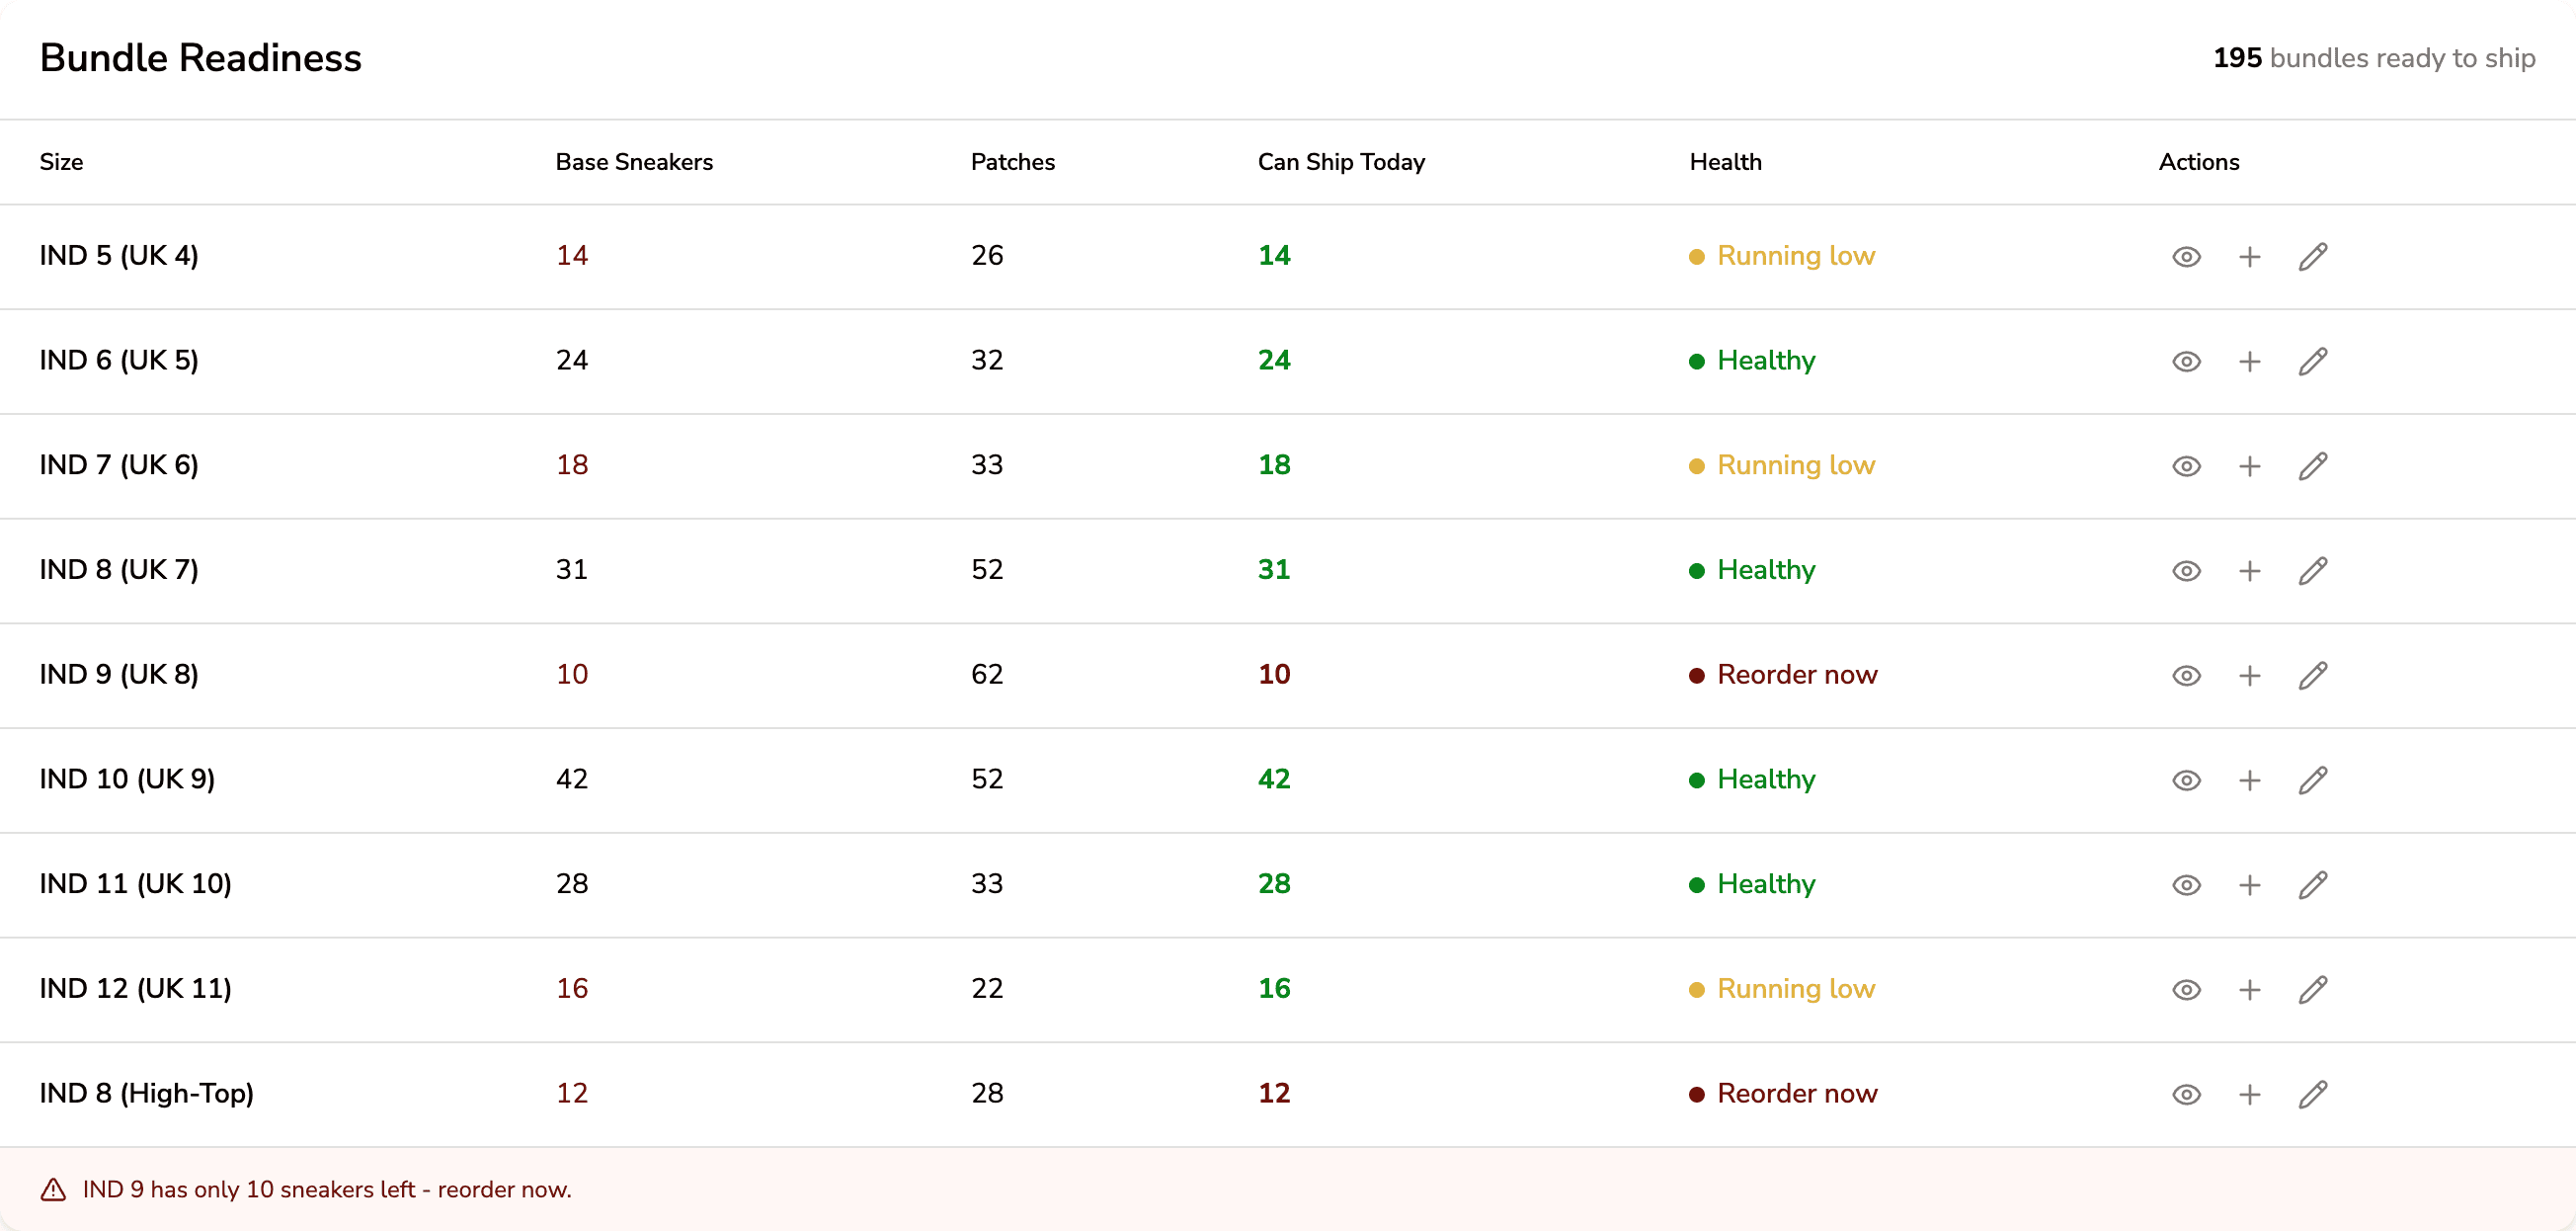
BUNDLE READINESS · INVENTORY

1
1
2
2
3
3
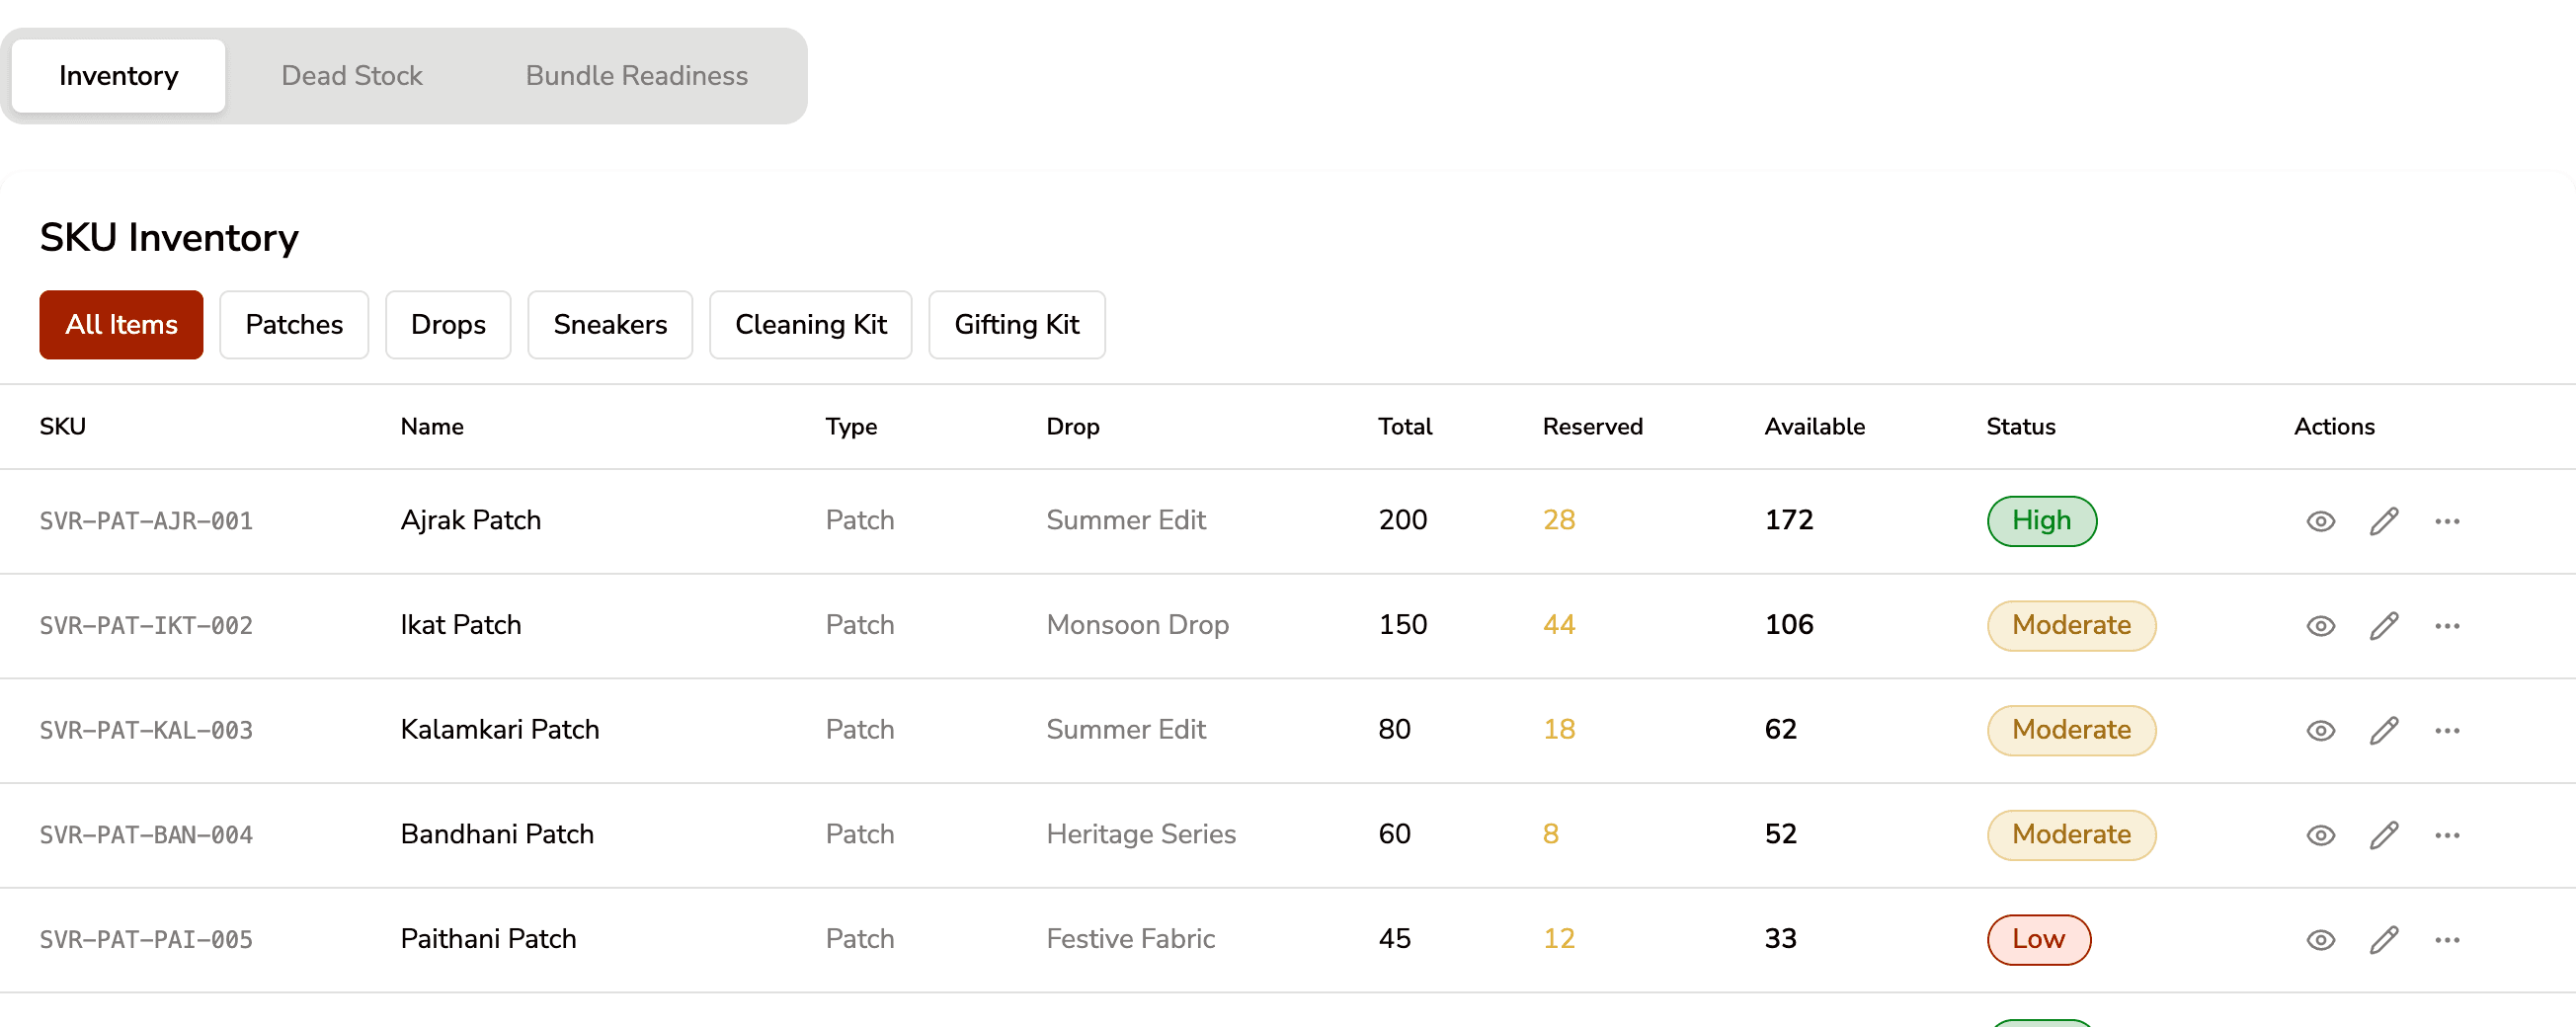
One row per size: sneakers, patches, and pairs that can ship.
1
1
Sneakers and patches are counted separately.
2
2
Can Ship Today is the smaller of the two counts.
3
3
IND 9 holds 62 patches but only 10 sneakers, so 10 pairs.
07
07
Every chart ends in a button
A dashboard that only reports leaves the hard part to the operator. Every insight here carries its action.
DATA → INSIGHT → ACTION, ON ONE SCREEN

1
2

1
2
1
1
Data
Data
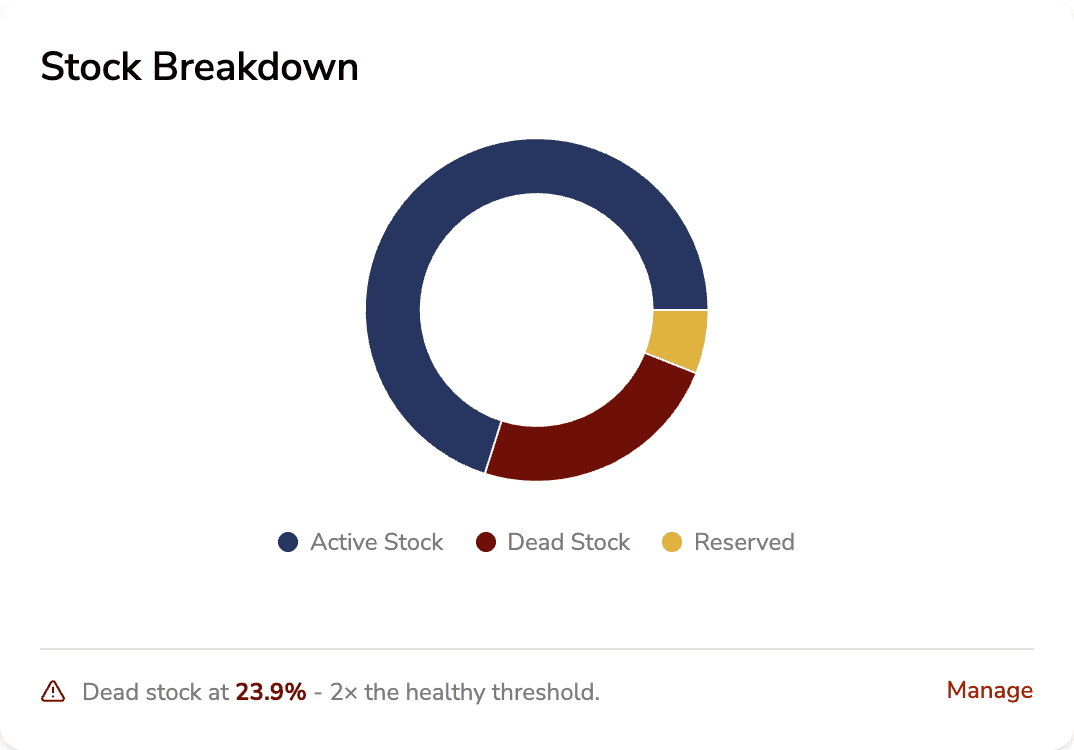
The chart shows how big the problem is.
2
2
Insight
Insight
The line underneath says whether it needs attention.
3
3
Action
Action
One button opens the SKUs themselves, already grouped.

3

3
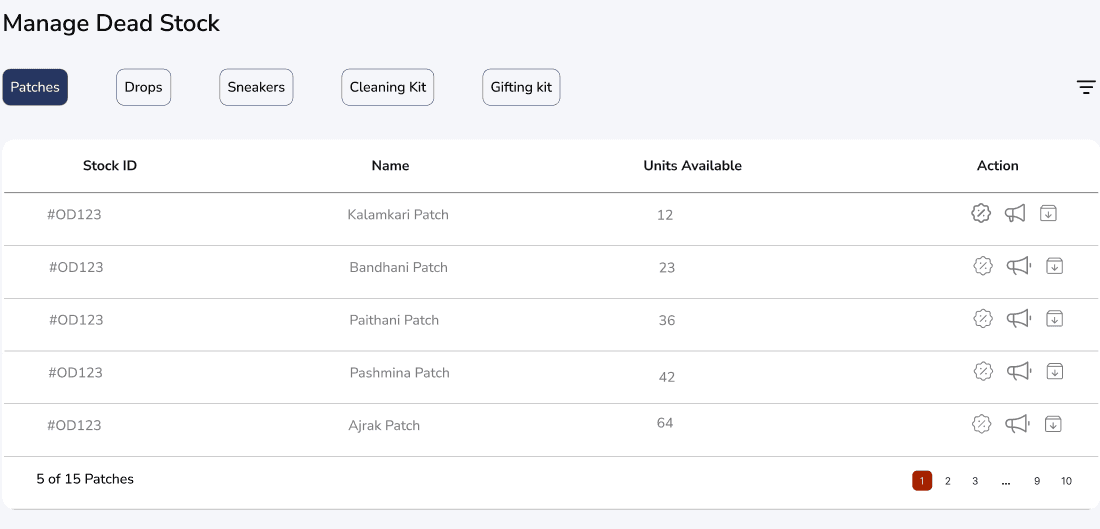
The chart says what the number means, then gives one button to act on it.
MEASURED VS MANAGED · DEAD STOCK

WHAT SHOPIFY GIVES YOU
Shopify measures it. That is where it stops.
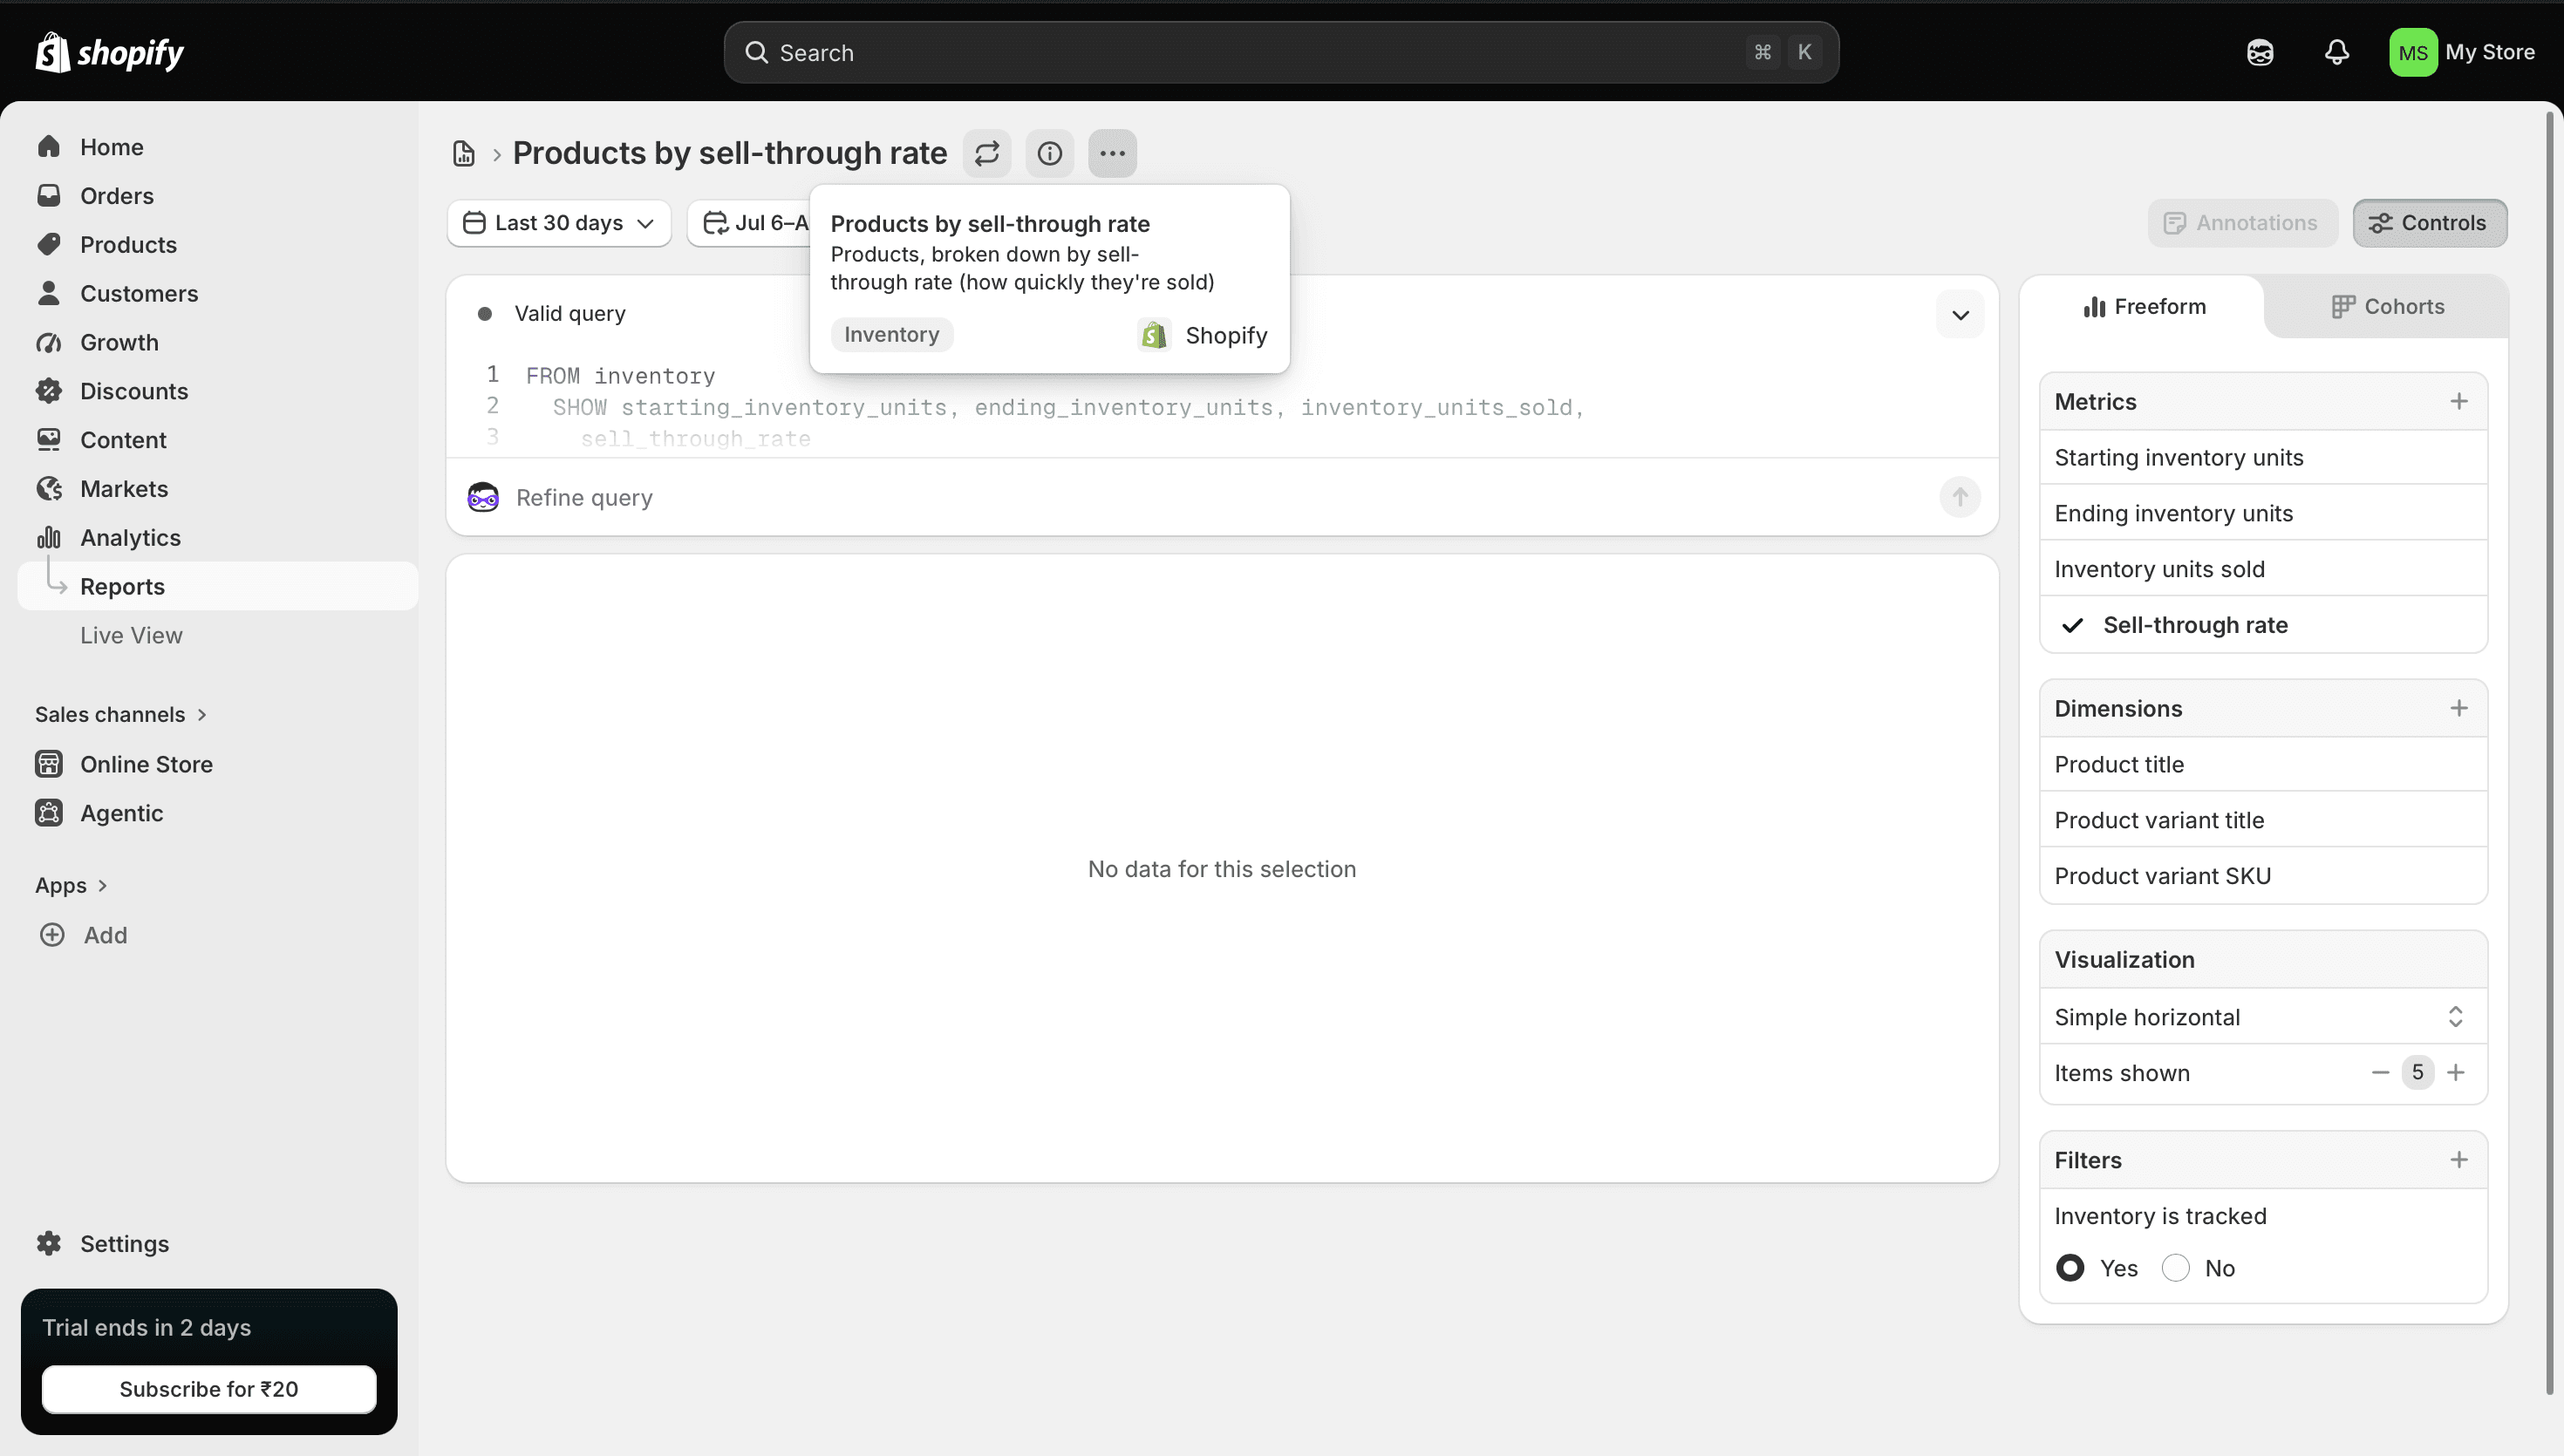
Products by sell-through rate shows how quickly stock is selling. Its dimensions are product title, variant and SKU. You get a number and nothing to do with it: no reason it stopped selling, no status, no action.
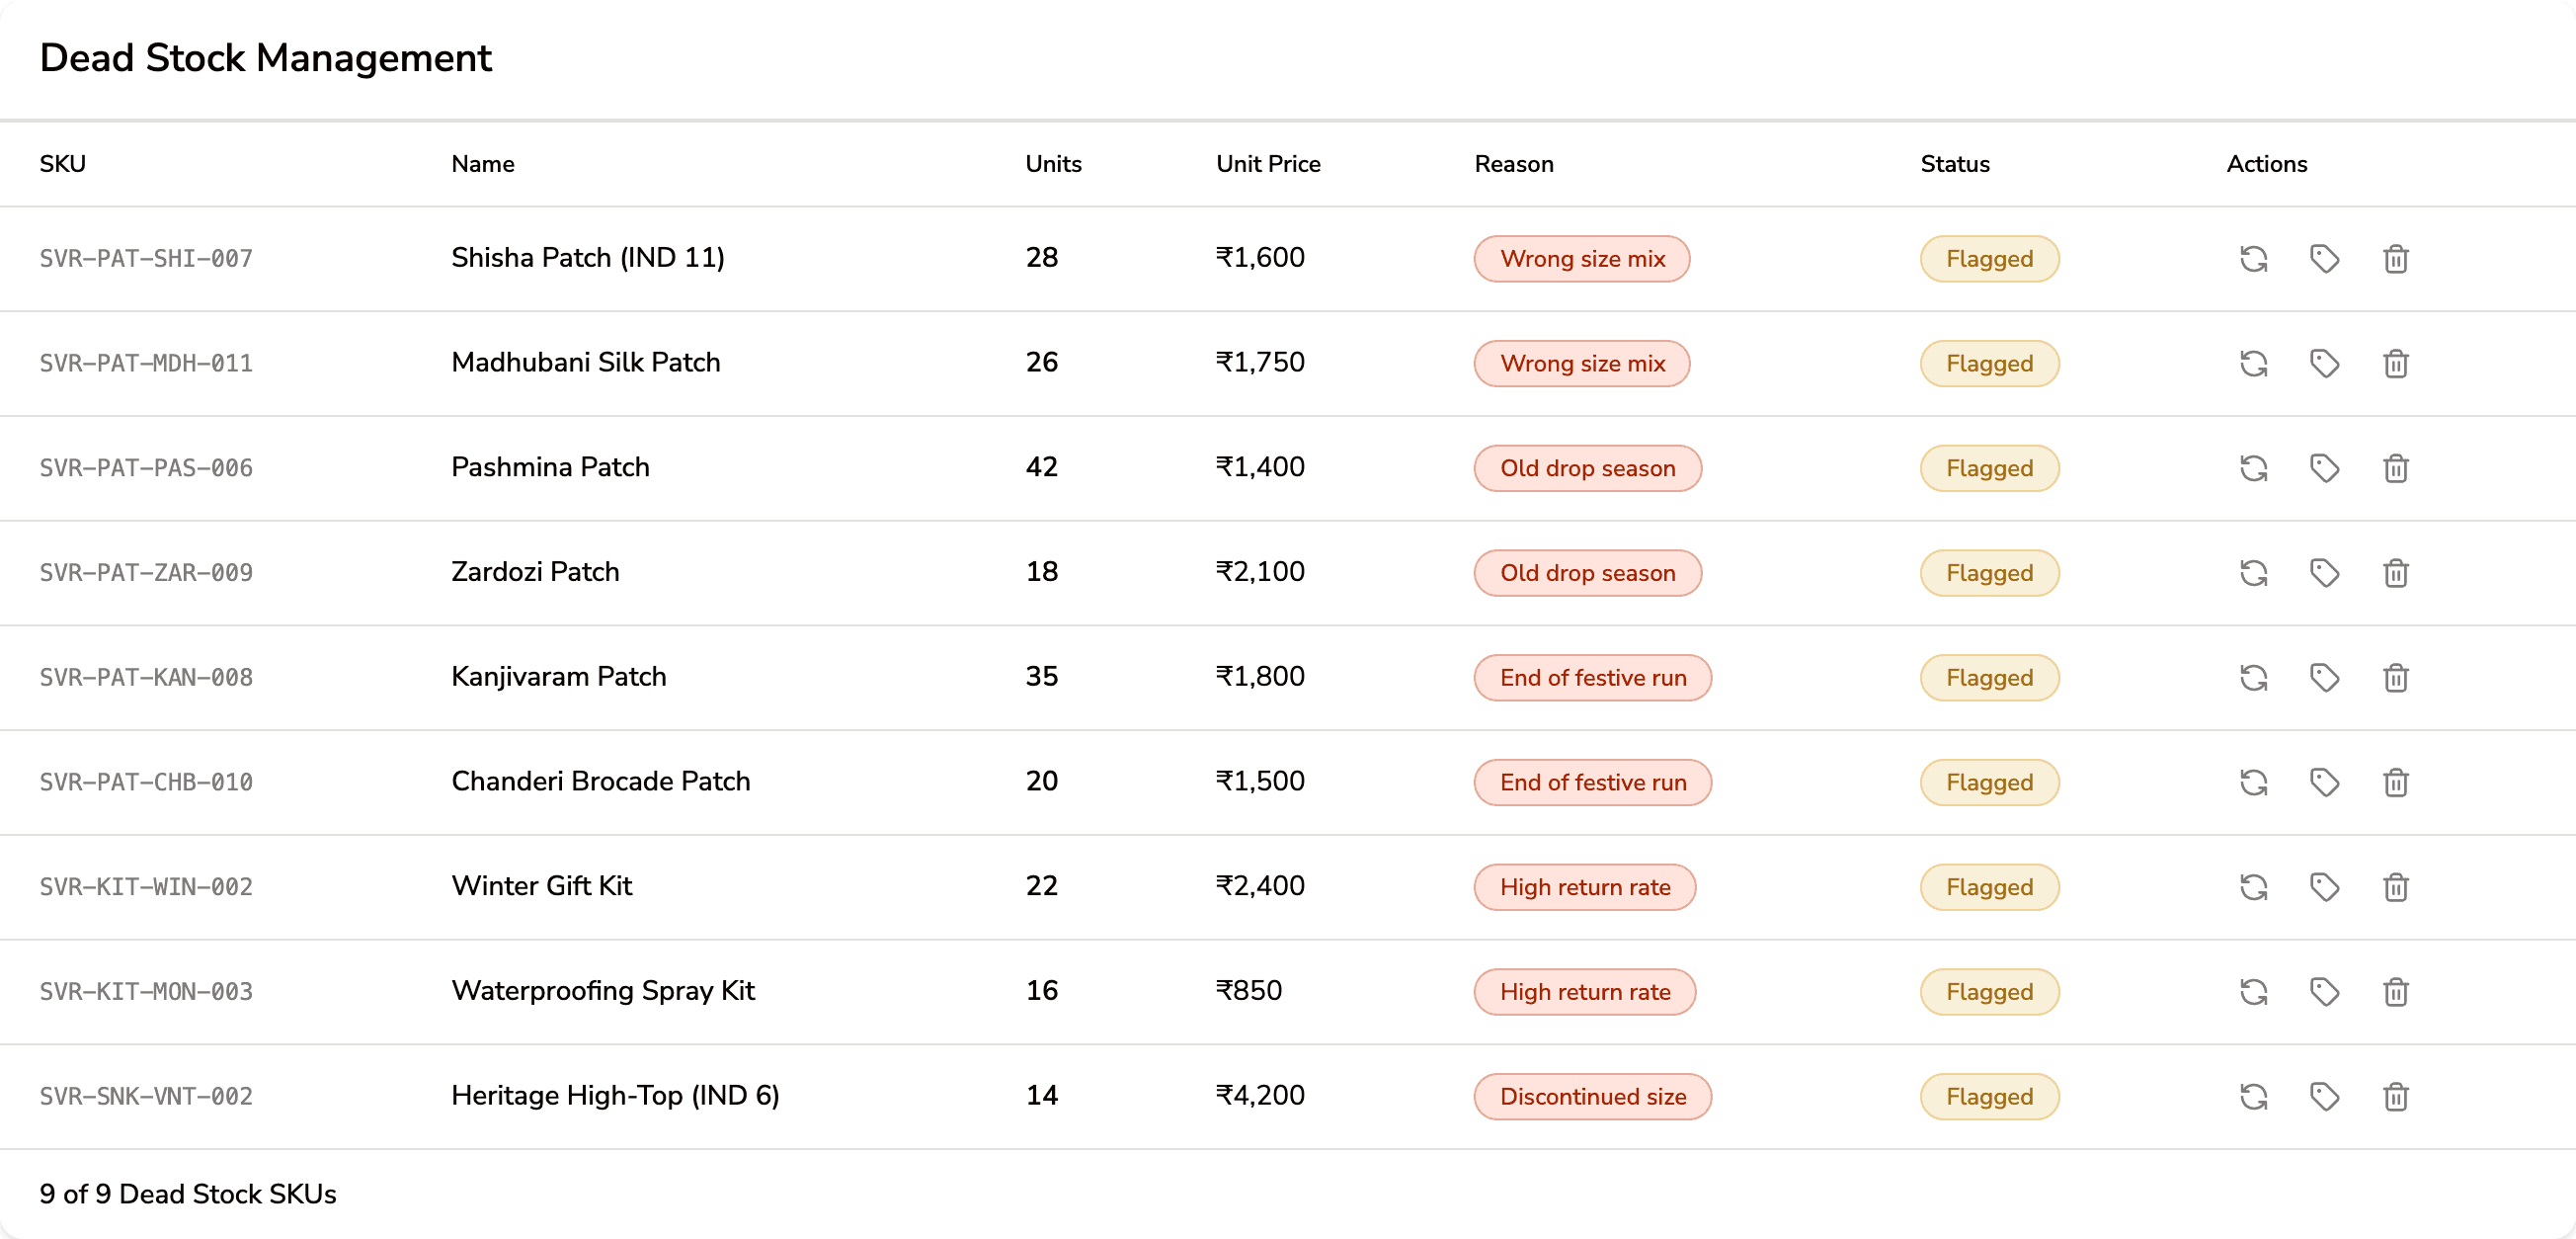
Below is what I built instead.

1
1
2
2
3
3
Reason and status are separate columns, so the operator acts on the cause, not the symptom.
1
1
Reason comes first: why it stopped selling.
2
2
Status is the triage state, waiting for a decision.
3
3
The response sits on the same row as the reason.
08
08
Three things I got wrong first
Each fix came from a specific failure.
ITERATION 01 · ONE LONG PAGE BECAME TABS
V1
V1
Everything stacked vertically
KPIs, charts, insights and actions on a single page.
→
→
PROBLEM
PROBLEM
Too much scrolling, competing information
Reviewed the layout with a peer experienced in data visualization.
→
→
V2
V2
Tabular + tab-based structure
Related information accessible within the same workspace.
More information doesn’t mean better visibility.
FROM SCROLLING TO STRUCTURE

Related information in one workspace, without a longer page.
ITERATION 02 · FEWER VISIBLE ACTIONS
BEFORE
BEFORE

AFTER
AFTER

Tables exposed every action at once. I cut to two, with the rest in an overflow.
ITERATION 03 · THE DASHBOARD SPEAKS FIRST

The alert sits above revenue with its action attached, so the problem finds the operator.
09
09
Everything in one workspace
Six areas, organised around the decisions one person actually makes.
Svaroots Ops Dashboard
Search
Search
Sync status
Sync status
Notifications
Notifications
Account and role
Account and role
Dashboard
Dashboard
Revenue KPIs
Revenue KPIs
Customer split
Customer split
Traffic sources
Traffic sources
Orders
Orders
Order table
Order table
Eleven states
Eleven states
Export CSV
Export CSV
Inventory
Inventory
Stock KPIs
Stock KPIs
Size run health
Size run health
Dead stock
Dead stock
Bundle readiness
Bundle readiness
Users
Users
User KPIs
User KPIs
Insights
Insights
User directory
User directory
Content & CMS
Content & CMS
Products
Products
Banners
Banners
Campaigns
Campaigns
Stories
Stories
Site settings
Site settings
Analytics
Analytics
Sales
Sales
By category
By category
Top products
Top products
Returns
Returns
Settings
Settings
Team & roles
Team & roles
Brand account
Brand account
Billing
Billing
Activity log
Activity log
THE SIX AREAS, AS BUILT

Overview
Overview
Business health, KPIs, priority actions.

Orders
Orders
Order monitoring and management.

Inventory
Inventory
Stock, size health, bundle readiness, runway, dead stock.

Users
Users
Customer information and segmentation.

Analytics
Analytics
Returns, revenue, product performance.

Settings
Settings
Roles and controls.
Roles and controls.
10
10
I built it, not just designed it
Seven Figma screens are not seven working screens. Building it forced the details.
FROM DESIGN TO WORKING PROTOTYPE
Navigation
Navigation
Date ranges
Date ranges
Tables
Tables
Actions
Actions
Dashboard states
Dashboard states
Interactions
Interactions
Figma
Figma
→
→
Figma Make
Figma Make
→
→
GitHub
GitHub
→
→
Vercel
Vercel
Try the working prototype
11
11
What I’d test with real operators
The tooling question is answered. The human one is not. Nothing here has met a real warehouse.
WHAT I’D DO NEXT
WHAT I’D DO NEXT
01
01
Speak with e-commerce operators and warehouse teams
02
02
How they actually monitor inventory
03
03
How they define dead stock
04
04
How they evaluate performance and decide what needs immediate action
05
05
Whether Bundle Readiness and Customization Rate are useful day to day
06
06
Check whether a third-party bundle app already surfaces component readiness
07
07
Pressure-test the dead-stock threshold with someone who has traded a bundle catalogue
I started with “What should I put on the dashboard?” I ended with “What decision should this information help someone make?”
That shift, from displaying data to designing for decisions, was the biggest learning from the project.